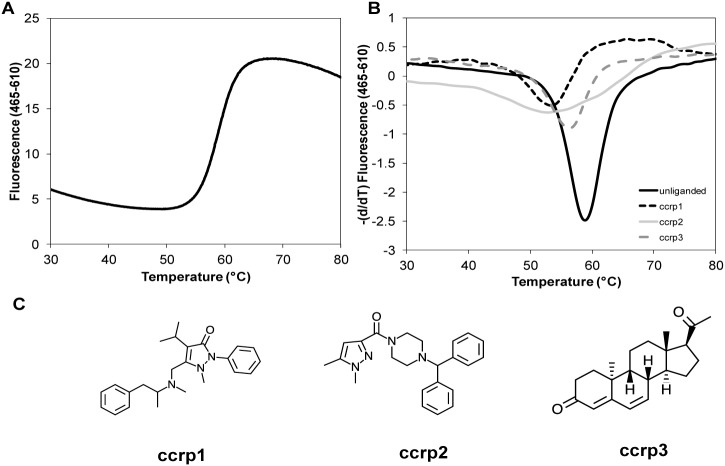
Figure 4. Results of direct binding assays using the DSF method.
A. This panel represents the melting curve of purified TLX LBD in the presence of 5% DMSO. B. This panel allows a rapid visualization on how compounds binding to TLX LBD can shift the reference Tm. We plotted the first derivatives of the melting curves for unliganded TLX LBD and TLX LBD in presence of ccrp1, ccrp2 and ccrp3. While these curves were utilized to accurately calculate Tm, a rough approximation of the Tm would be the minimum of the first derivative curves. In presence of the three compounds this minimum shifted downward. C. This panel displays the chemical structures of ccrp1, ccrp2, and ccrp3.

