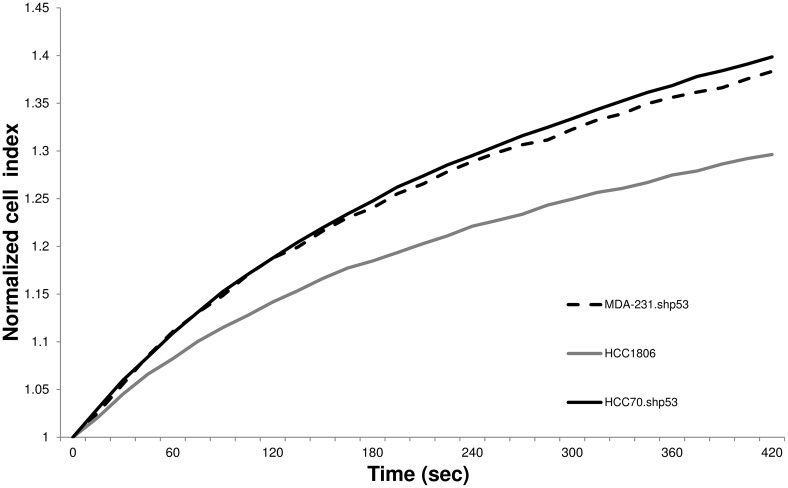
Figure 6. Average variations of the impedance (CI) as the function of time resulted from the swelling.
Mtp53-expressing cell lines (MDA-231.shp53 (clone 1D10) (dotted black), HCC70 (solid black)) and no p53-expressing cell line (HCC1806, solid grey) were measured under hyposmotic stress using xCELLigence system.

