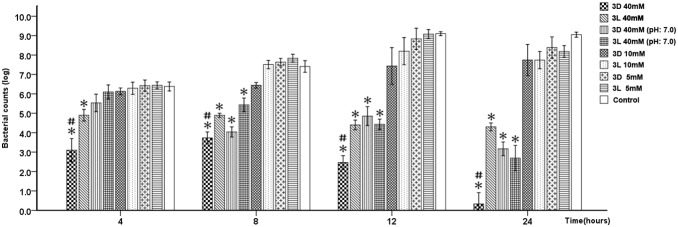
Figure 1. Effect of 3D-AAs and 3L-AAs on S. mutans growth.

All of the determinations were repeatedly performed three times on different days. The y-axis represents the survival count of bacteria (mean ± SD), and the x-axis represents the time after the challenge with amino acids. “*” indicates a significant difference in the S. mutans survival count between the amino acid challenge groups and the control, and a value of p<0.00625 was considered significant; “#” indicates a significant difference in the S. mutans survival count between the 3D-AA and 3L-AA challenge groups, and a value of p<0.05 was considered to be significant.
