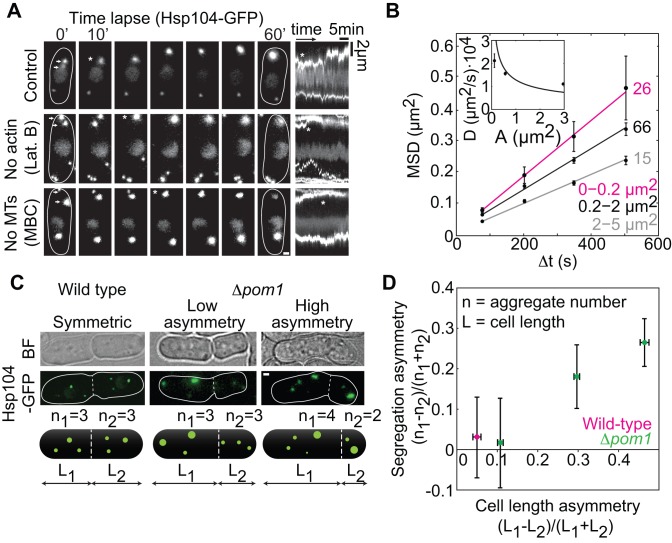
Figure 1. Aggregates move by diffusion and segregate proportionally to the cell volume.
(A) Aggregate movement and fusion in control cells and after cytoskeleton depolymerization (Latrunculin B and MBC); kymographs (space-time plots, right). The fusion of two aggregates (arrows at 0′) is marked by an asterisk. (B) Mean squared displacement (MSD) of aggregates in control cells grouped by area (see labels) and a weighted fit MSD = 4DΔt + offset (lines). (Inset) Diffusion coefficient, D, versus area, A, weighted fit proportional to 1/√A as expected from Stokes diffusion. Fitting with a nonlinear equation (MSD = v2(Δt)2 + 4DΔt + offset) yielded a worse fit (parameter-adjusted r2, linear(2–5 µm2) = 0.996, nonlinear(2–5 µm2) = 0.969). (C) Aggregate segregation (|n1−n2|) at division in wild type and Δpom1. (D) Aggregate segregation asymmetry versus cell length asymmetry (n>30 cells/data point). The data are mean ± SEM from >3 independent experiments; scale bars, 1 µm. See also Figures S1 and S2.

