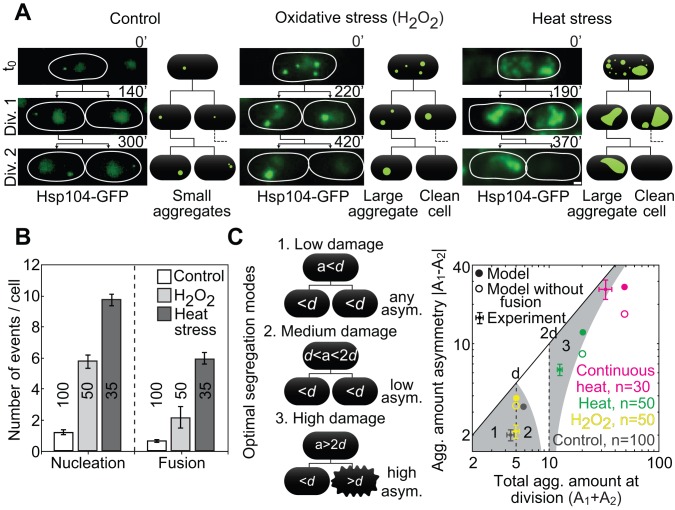
Figure 3. A transition to asymmetric segregation after stress.
(A) Aggregate segregation after stress (Hsp104-GFP, see labels). Thin lines encircle cells; scale bar, 1 µm. (B) Aggregate nucleation and fusion during the first cell cycle after stress. (C, Left) Three distinct optimal segregation regimes (1–3) that maximize the number of surviving cells depending on the aggregate amount in the mother cell at division (a): (1) any segregation asymmetry when the total aggregate amount is below the death threshold (d), (2) low segregation asymmetry when the amount is between d and 2d, and (3) high asymmetry when the amount is above 2d. Black lines represent pedigree lineage, and the rough cell edge represents cell death (cell lysis and shrinkage, followed by absence of growth). (Right) Aggregate amount asymmetry (absolute difference in the amount between sister cells at birth) under favorable conditions (“Control”) and at division 2 after stress: 1 mM H2O2 for 1 h (“H2O2”), 40°C for 30 min (“Heat”), continuous growth at 40°C (“Continuous heat”), and the model (see labels). Grey areas numbered 1–3 are the optimal segregation regions (see scheme and text). The data are mean ± SEM; number of cells from >3 independent experiments are given in graphs. See also Figure S4.

