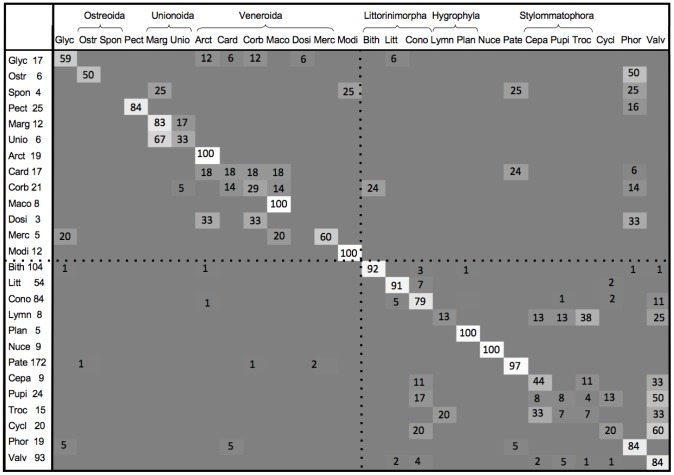
Figure 3. Classification results.
Results of the classification performed using Learning Vector Quantization. Leave-one-out (L-O-O) classification was used for validation and the results show how the test samples were classified. Each row represents one of the 26 genera included in the analysis, as indicated on the left of the table together with the number of examples tested. The four-letter codes uniquely identify each genus (full names in Table 1). The columns show the predicted genera. Numerical values are percentages so that the element in column i of row j shows the percentage of genus j that were classified as genus i and the main diagonal shows the percentage of each genus correctly classified. The dotted lines separate Bivalvia from Gastropoda and brackets above the predicted class names group genera within the same order. The grey-scale intensities are related to the numerical values with white corresponding to 100% and the darkest grey to 0% (for which no numerical value is given). Note that rounding may result in rows not summing to 100%.

