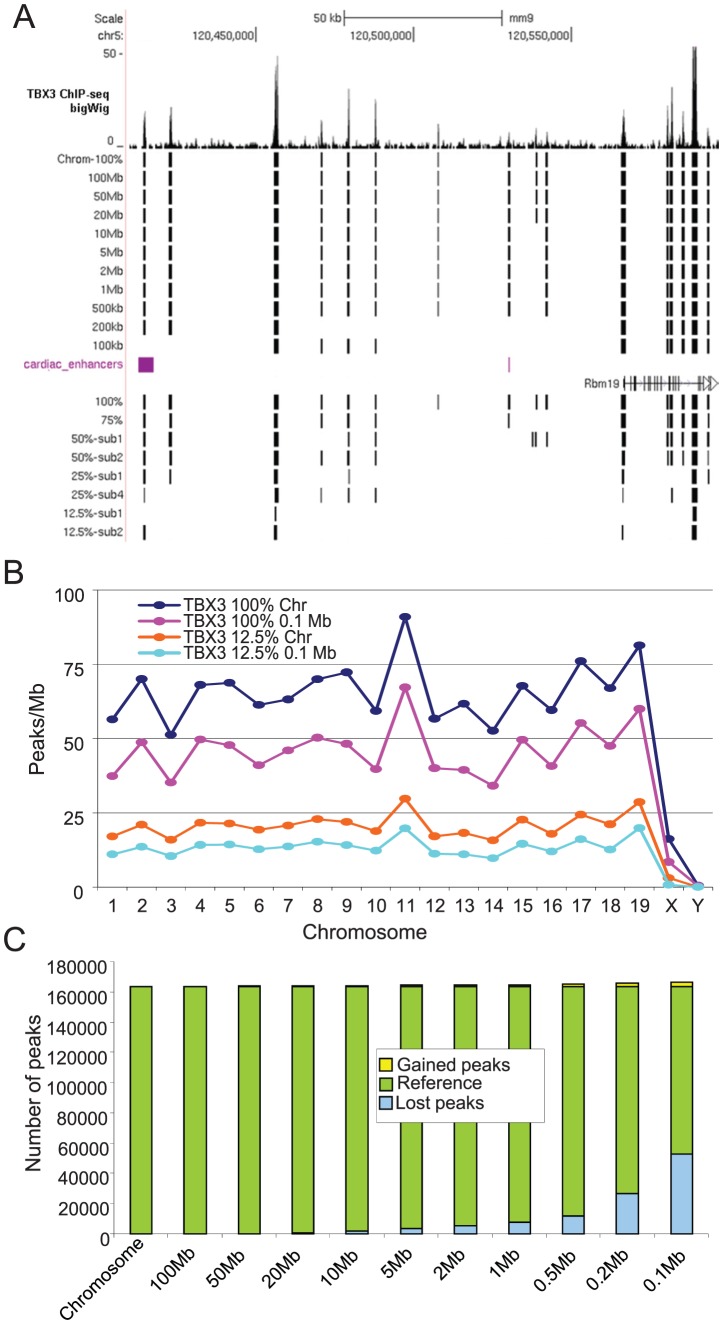
Figure 4. Effect of window size and tag density on the pattern and number of called peaks.
Peaks were called with OccuPeak in the TBX3 ChIP-seq dataset using different window sizes and tag densities. A. UCSC genome browser snapshot capturing the effects on peak calling in a region containing 2 validated cardiac enhancers. B. Mean number of peaks called per Mb of genome. Note the (almost perfect) parallelism of the profiles for different tag density (100% and 12.5%) and window size (chromosome and 0.1 Mb). C. Effect of window size on the gain or loss of peaks. When the peaks called with a chromosome-wide window are used as a reference (green), smaller windows lead to loss of peaks (blue) but hardly ever to gain of peaks (yellow).

