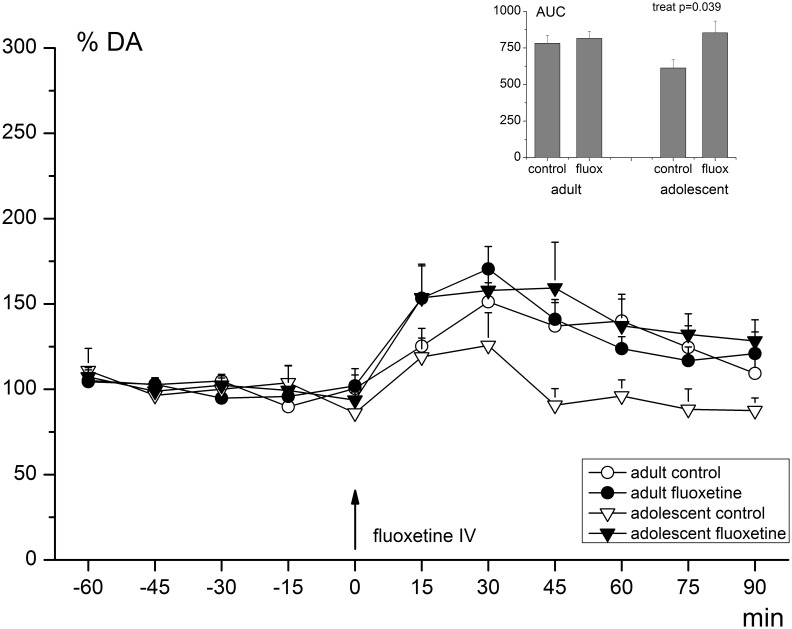
Figure 3. Extracellular DA levels in the mPFC before and after acute FLX challenge.
Levels are given as percentage (%) of the average baseline value ( = 100%). DA release was significantly increased after the acute FLX challenge in all groups (RM-ANOVA; effect of time (F10,190 = 12.037, p-value<0.001) and reaches its maximum after approximately 30 minutes. The AUC values (inset) showed a significant effect of treatment (increased release in treated animals), this was however not confirmed by the RM-ANOVA analysis (no time-by-treatment effect; p-value>0.100). Black arrow indicates the time point of the acute FLX challenge (5 mg/kg, i.v.). Error bars represent one S.E.M.

