
Figure 2. DL elevation.
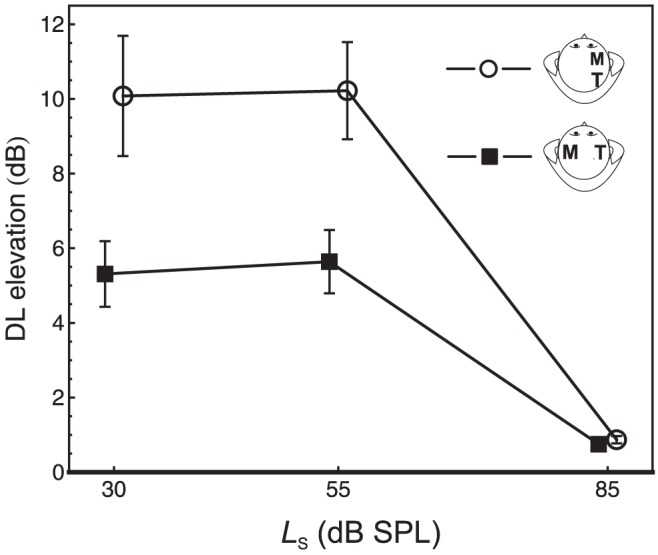
Average masker-induced DL elevation, representing the difference between the DL (10 log10[ΔI/I +1]) under forward masking and in quiet. Circles: maskers lateralized to the same side of the head as the standard. Squares: maskers lateralized to the contralateral side of the head as the standard. Error bars: 95%-CIs.