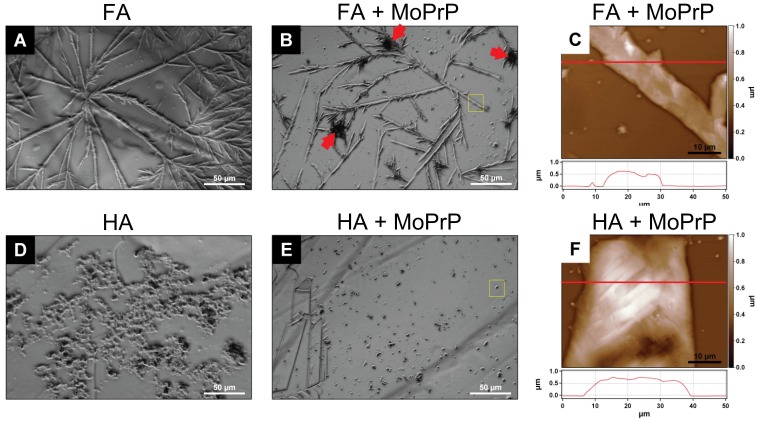
Figure 3. Macroscopic characterization of humic substances.
Phase contrast optical images of HS morphology when deposited on a mica surface (20 µg/mL of FA and HA, respectively in A and D) were compared to MoPrP-HS complexes morphology deposited under the same conditions (B shows complexes between 60 µg/mL of MoPrP and FA, E depicts those with HA). Red arrows in B point at “brush-like” structures possibly ascribable to MoPrP clusters. Yellow squares highlight the FA and HA structures analyzed by AFM in panels C and D, representing three-dimensional AFM reconstructions of FA-MoPrP fractal fibers and HA-MoPrP assemblies, respectively.

