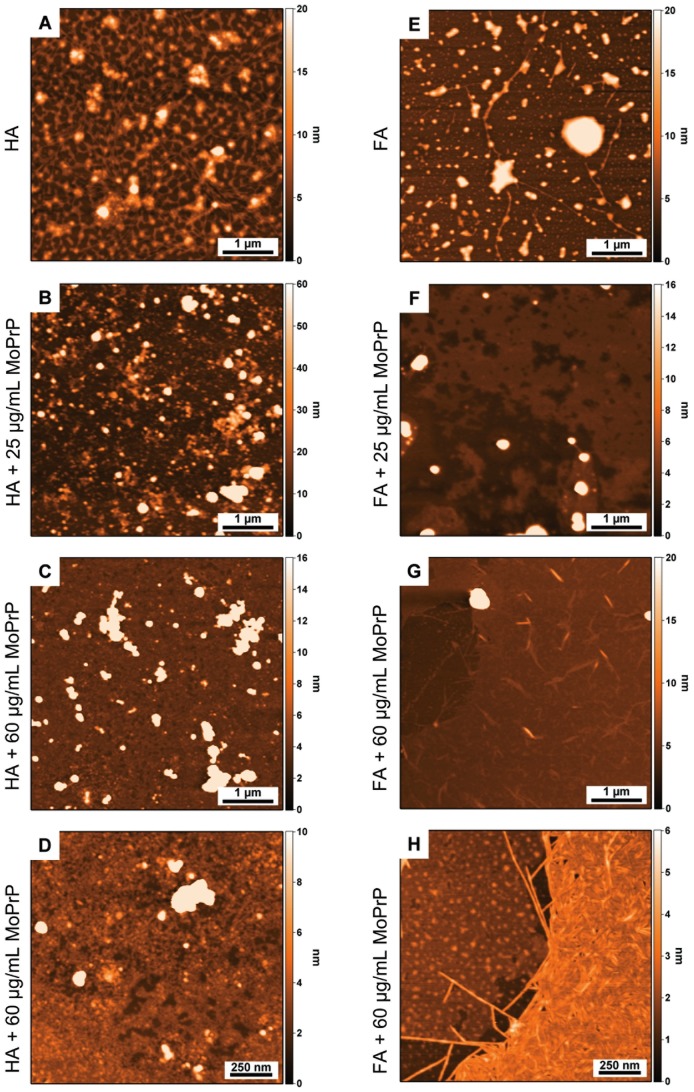
Figure 4. AFM characterization of HS and MoPrP-HS complexes.
Surface morphology of HS alone (HA and FA in panels A and E, respectively) and HS complexes with 25 µg/mL of MoPrP (in panels B and F corresponding to MoPrP-HA and MoPrP-FA complexes, respectively) and with 60 µg/mL of MoPrP (in panels C and G with HA and FA, respectively). Panels D and H show high magnification images of the samples presented in panels C and G.

