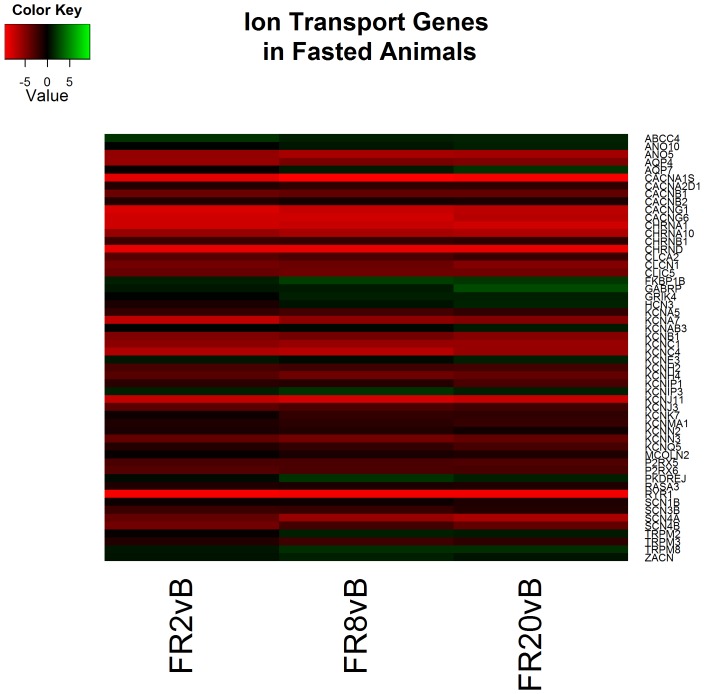
Figure 9. Heatmap of log2 fold changes of genes associated with ion transport in fasted (FS) animals at each resuscitation timepoint (2, 8, and 20 hours) relative to Baseline (B).
Rows are differentially expressed genes (DEGs) following RNA sequencing. Columns denote the respective timepoints Baseline (B), 2 hours full resuscitation change from Baseline (FR2vB), 8 hours full resuscitation change from Baseline (FR8vB), and 20 hours full resuscitation change from Baseline (FR20vB). Green denotes increased mRNA expression with respect to Baseline whereas red denotes the opposite.

