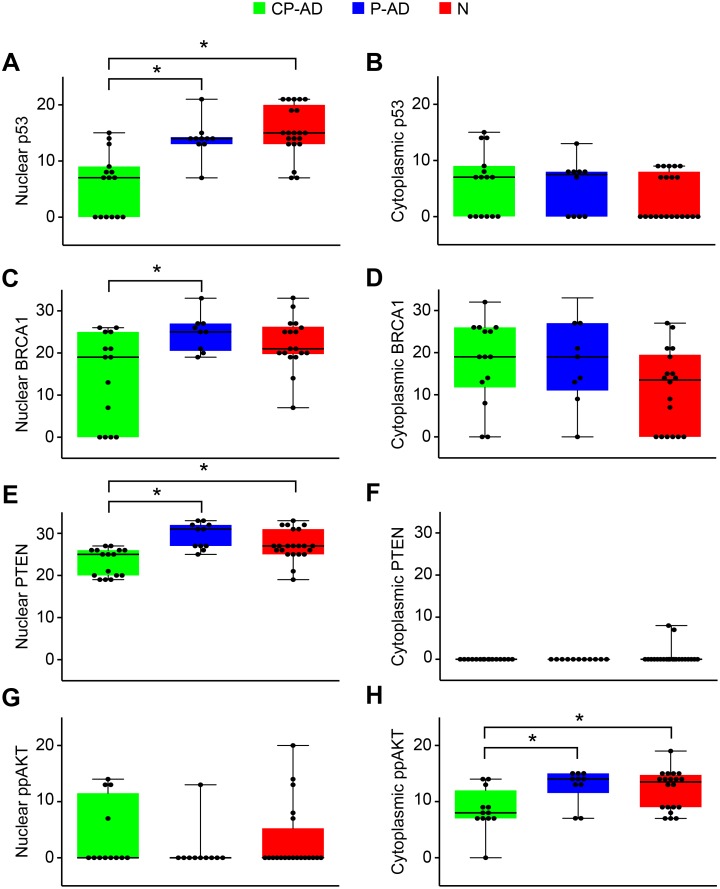
Figure 2. Expression levels of markers related to DNA repair.
Boxplots of p53 scores attributed to nuclear (A) and cytoplasmic (B) staining. Boxplots of BRCA1 scores attributed to nuclear (C) and cytoplasmic (D) staining. Boxplots of PTEN scores attributed to nuclear staining (E) and cytoplasmic (F) staining. Boxplots of phospho-AKT scores attributed to nuclear (G) and cytoplasmic (H) staining. CP-AD, clinical-pathological Alzheimer’s disease (green boxes); P-AD, pathological Alzheimer’s disease (blue boxes); N, normal aging (red boxes).

