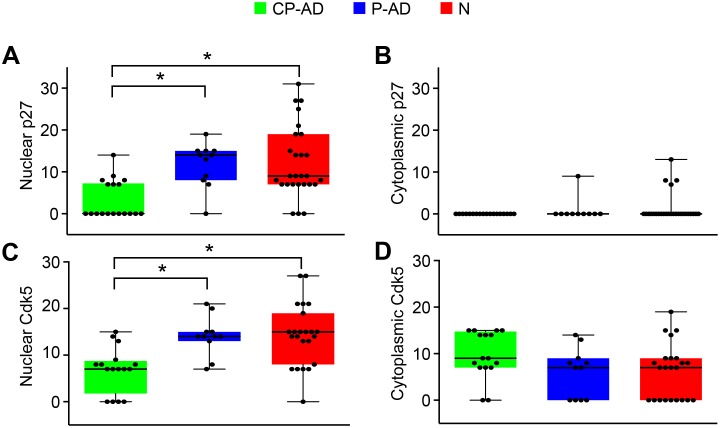
Figure 4. Expression levels of markers related to cell-cycle inhibition.
Boxplots of p27 scores attributed to nuclear (A) and cytoplasmic (B) staining. Boxplots of Cdk5 scores attributed to nuclear (C) and cytoplasmic (D) staining. CP-AD, clinical-pathological Alzheimer’s disease (green boxes); P-AD, pathological Alzheimer’s disease (blue boxes); N, normal aging (red boxes).

