
Figure 1. CD spectra of the CF3-Bpg labeled TP10 analogs.
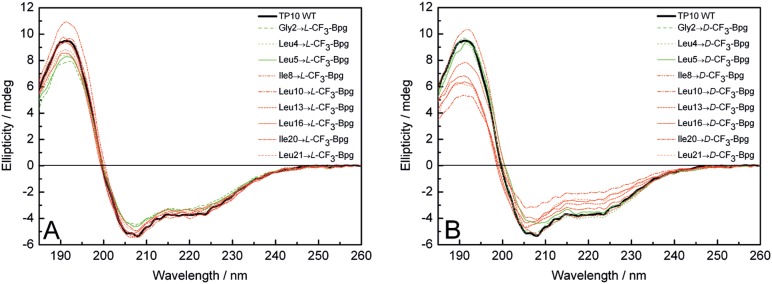
CD spectra are recorded in the presence of unilamellar DMPC/DMPG (3∶1) vesicles at a P/L ratio of 1∶200. (A) L -epimers and (B) D -epimers are compared with the WT peptide (black line). Analogs with CF3-Bpg in the galanin part are represented by green lines and in the mastoparan part by red lines.