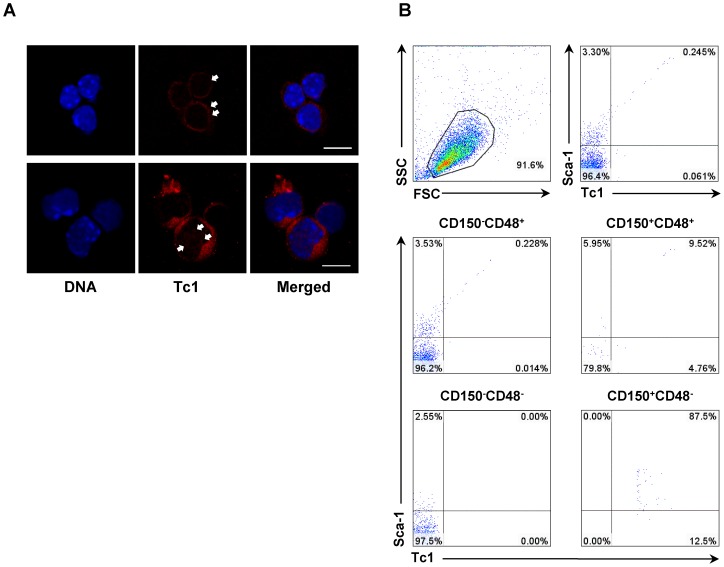
Figure 4. Tc1 expression in bone marrow cells.
(A) Confocal microscopic images of Tc1-positive cells in wild type mice bone marrow. DNA staining is done using Hoechst 33342. Relatively weak cytoplasmic staining (arrows) is present in HSC-like primitive cells (upper panel). Large progenitor cells show strong cytoplasmic staining and faint nuclear staining (arrows) (lower panel). Scale bars represent 10 µm. (B) Representative flow cytometric analysis for Tc1 and Sca-1 in total Lin− bone marrow cells (upper panels), and gated cells according to CD150/CD48 profiles (lower panels).

