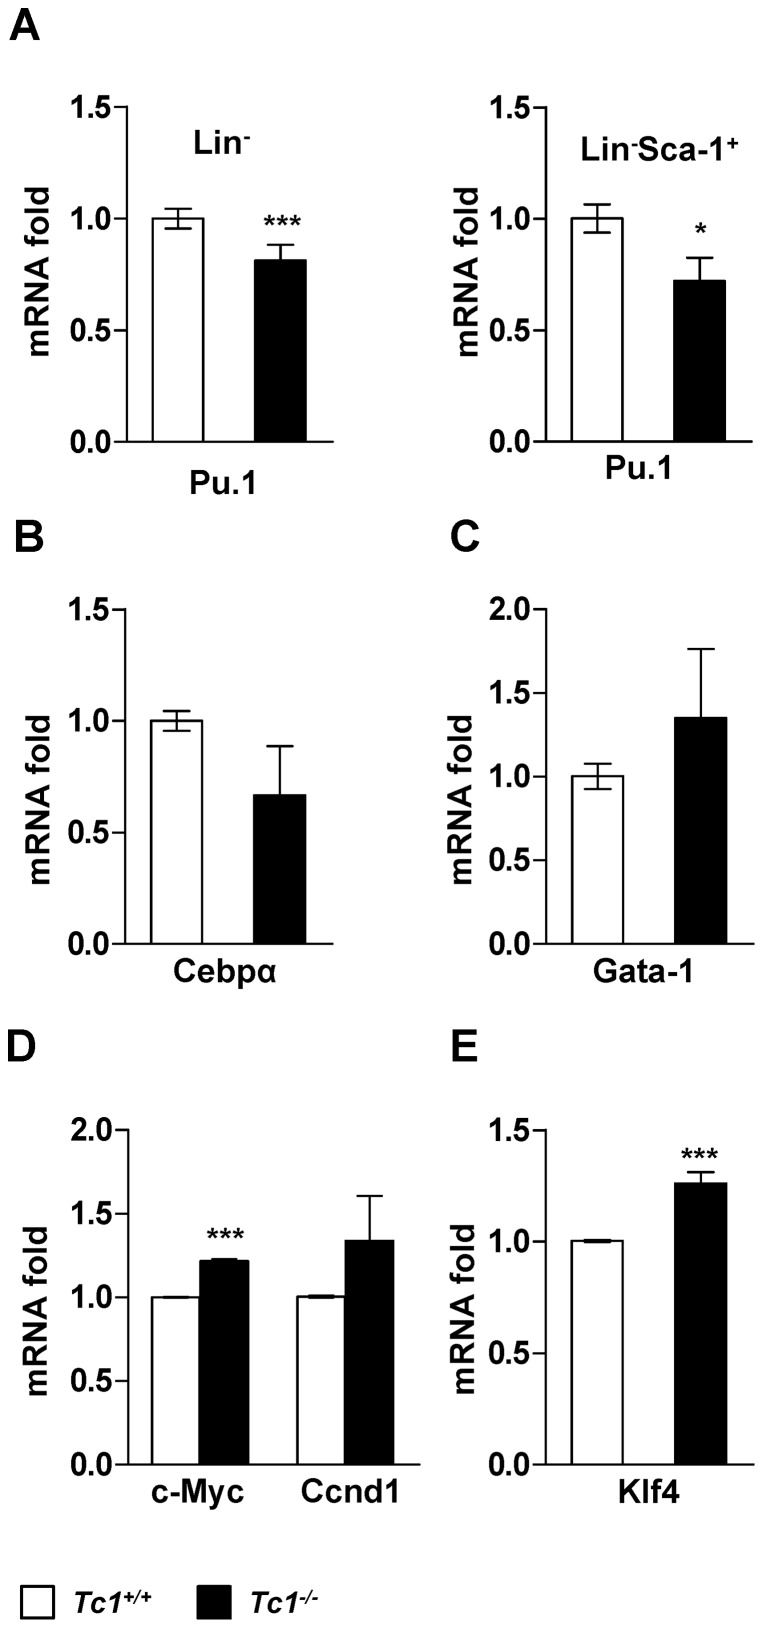
Figure 6. Hematopoietic lineage- and pluripotent stem cell-regulators.
(A) qPCR analysis for Pu.1 expression in total Lin− cells (left) or sorted Lin−Sca-1+ cell fraction (right) of Tc1−/− and wild type mice bone marrow. Data represent mean ± s.d. of 6 male, 8 week-old Tc1 −/− mice, and 6 sex- and age-matched control mice over 3 independent experiments for the total Lin− cell assay, and 10 male, 8 to 9 week-old Tc1 −/− mice, and 10 sex- and age-matched control mice over 2 independent experiments for the sorted-Lin−Sca-1+ fraction assay, respectively. (B–E) qPCR analysis for Cebpα (B), Gata-1 (C), c-Myc and Ccnd1 (D), and Klf4 (E) expression in Lin− cells. Data represent mean ± s.d. of 6 male, 9 week-old Tc1 −/− mice, and 6 sex- and age-matched control mice over 3 independent experiments. **p<0.01; ***p<0.001.

