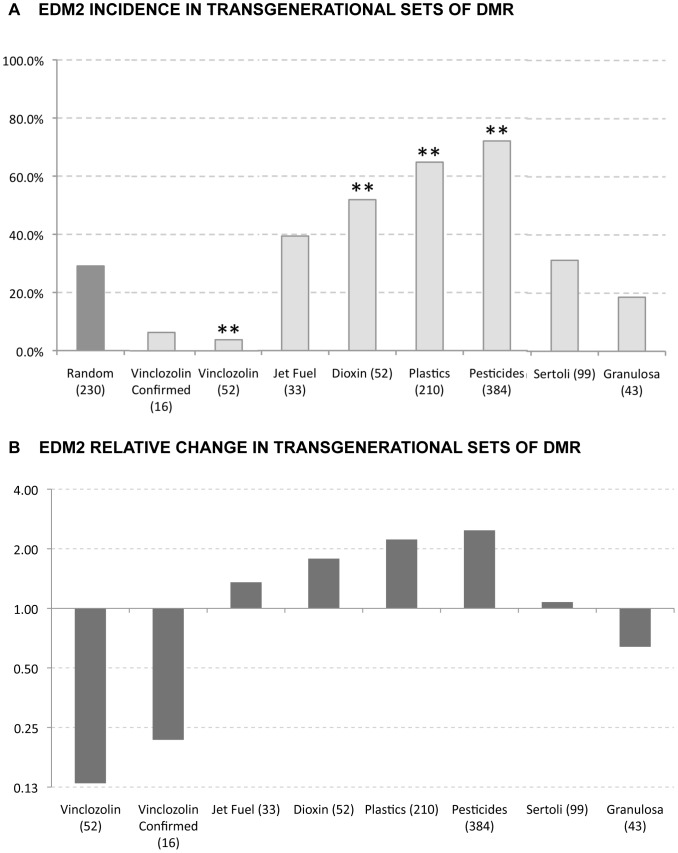
Figure 3. EDM2 incidence in exposure epimutation data sets.
(A) Individual occurrence (percentage) of EDM2 in a variety of sets with transgenerational DMR and (B) relative change of EDM2 in these DMR. Columns with ** represent significant change with p<0.01, while columns with * represent significant change with p<0.05.

