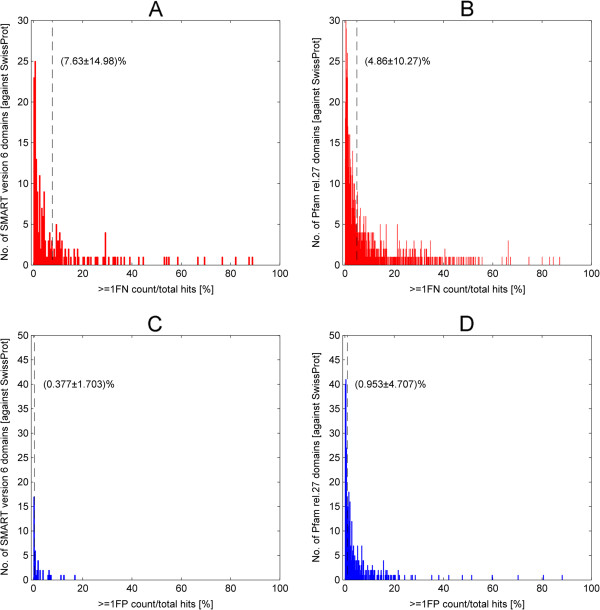
Figure 10.

Histograms of the false-negative and false-positive rates of 197 (out of 285) SMART and 1195 (out of 2381) Pfam domain models when applied to SwissProt/UniProt database. Figure A and B show the histograms of 197 (out of 285) SMART and 1195 (out of 2381) Pfam domain models with non-zero FN rates respectively. The remaining 88 SMART and 1186 Pfam domains with zero FN rate were excluded from the plots. In particular, the non-zero FN rate domains potentially generated FN hits in the HMM searches. On average, the FN rates were (7.63 ± 14.98)% and (4.86 ± 10.27)% for SMART and Pfam as marked by the vertical dashed lines. Similarly, Figure C and D depict the histograms of the non-zero FP rates for 42 (out of 285) SMART and 370 (out of 2381) Pfam domains. The remaining 243 SMART and 2011 Pfam domains with zero FP rates were excluded from the plots. In contrast to the FN rates, the FP rates were relatively lower. The average FP rate for SMART is (0.377 ± 1.703)% and (0.953 ± 4.707)% for Pfam, as depicted by the vertical dashed lines. Note that all the averages were taken over 285 SMART and 2381 Pfam domains respectively.
