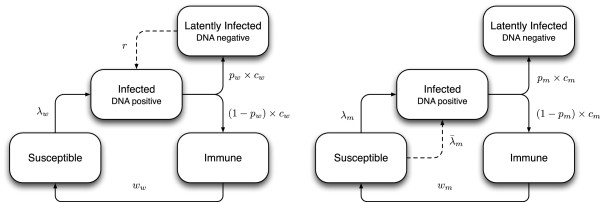
Figure 1.

Schematic diagram of the HPV-16 transmission model for females (left) and males (right). Here λw and λm are the forces of infection (i.e. the rates of becoming infected) for women and men, is an additional force of infection acting on older men whose partners become infected via reactivation, and other parameters are as in Table 1.
