
Figure 2.
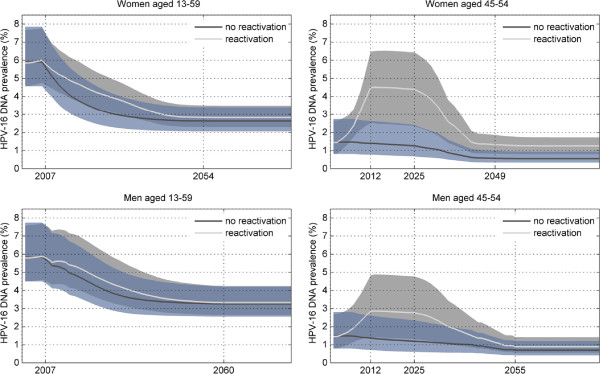
Temporal changes in HPV-16 DNA prevalence in men and women predicted by the model with and without reactivation in menopausal women. Solid lines are means and 95% confidence intervals are shown as shaded areas between the 2.5-th and 97.5-th percentiles. The panels on the left-hand side show the overall prevalence in the sexually active male and female populations. The panels on the right-hand side show prevalence in the older male and female populations where the effect of reactivation is much more pronounced.