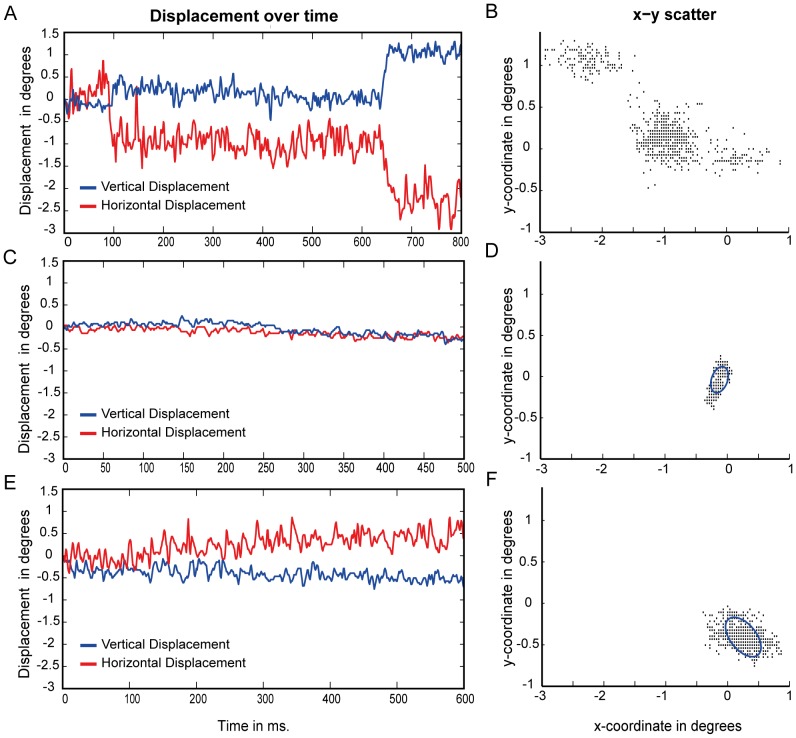
Figure 3. Time-course and scatterplot examples for different types of trials.
Panels A, C and E show example time-courses of eye-position over time, lines indicate horizontal (red) and vertical (blue) displacement over time. The example time-courses illustrate measurement with (A) and without (C) an intrusive saccade in control subjects and a typical trial without saccades or blinks of a JMD patient (E). Panels B, D and F show the corresponding eye-positions across the entire measurement duration, indicating the effect of saccade and blinks on the displacement spread (Panel B). Displacement was summarized by the BCEA and examples are shown in blue circles in panels D and E. Only trials that did not include these intrusive saccades or blinks were included in the analysis of the BCEA, displacement and power spectral densities.

