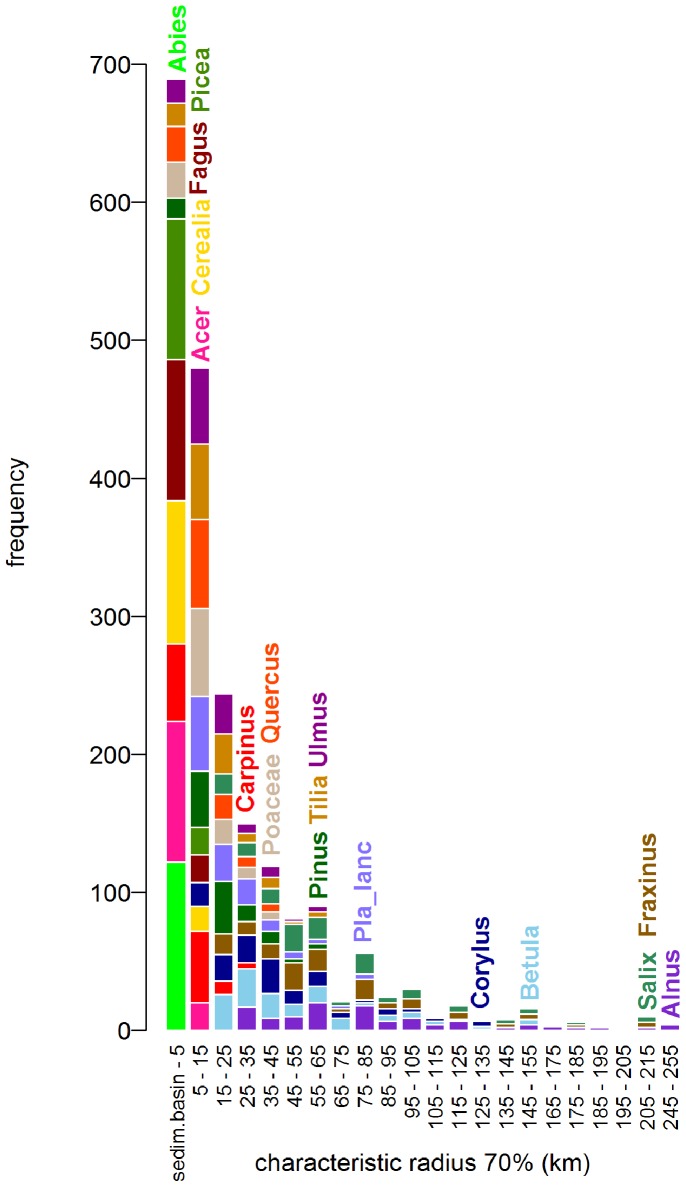
Figure 3. Histogram of “characteristic radii 70” (km) for all pollen taxa (17) at all sites (120).
Note the different distribution of taxa with light pollen grains (e.g. Alnus – purple) and heavy pollen grains (e.g. Abies – light green). The wide distribution is given by the variability of the radii (see Fig. 2). The name of each taxon is placed at the maximum distance given by the maximum sedimentation basin (1,262 m).

