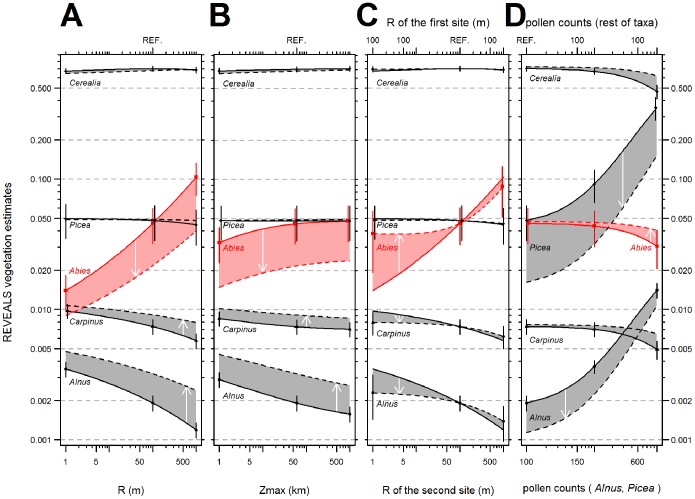
Figure 4. Simulation of REVEALS estimates (proportion in log scale).
Alnus-Capinus, Picea-Cerealia and Abies delimit three groups of terminal velocities of pollen: slow, medium and fast, which also represent the pattern of the rest of taxa not plotted here. Arrows show the change of estimates from control (full line) to scenario (dashed line); for details, see Table 2. (A) Simulation A: Increasing radius of the sedimentation basin under two wind speed velocities (B) Simulation B: Increasing radius of the area of the background pollen under two wind speed velocities. (C) Simulation C: Fixed versus increasing radius of the sedimentation basin of the second site. (D) Simulation D: Increasing pollen counts of Alnus and Picea under two radii of the sedimentation basin. The reference setting common to all control simulations is marked on the secondary horizontal axis by “REF”.

