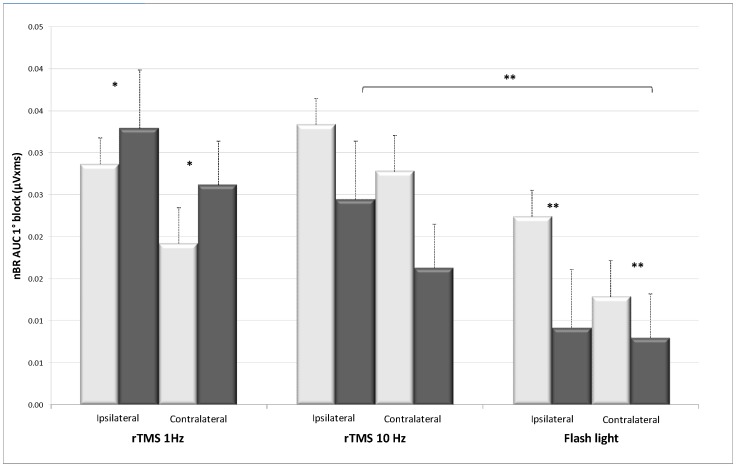
Figure 1. First block of 5 ispilateral and contralateral nBR responses (area under the curve in µVxms ± sem) before (light bars) and after (dark bars) 1 Hz rTMS, 10 Hz rTMS over the visual cortex, or flash light stimulation.
** p<0.01; * p<0.05. The inhibitory effect on the nBR is significantly stronger after flash light stimulation than after10 Hz rTMS over the visual cortex.

