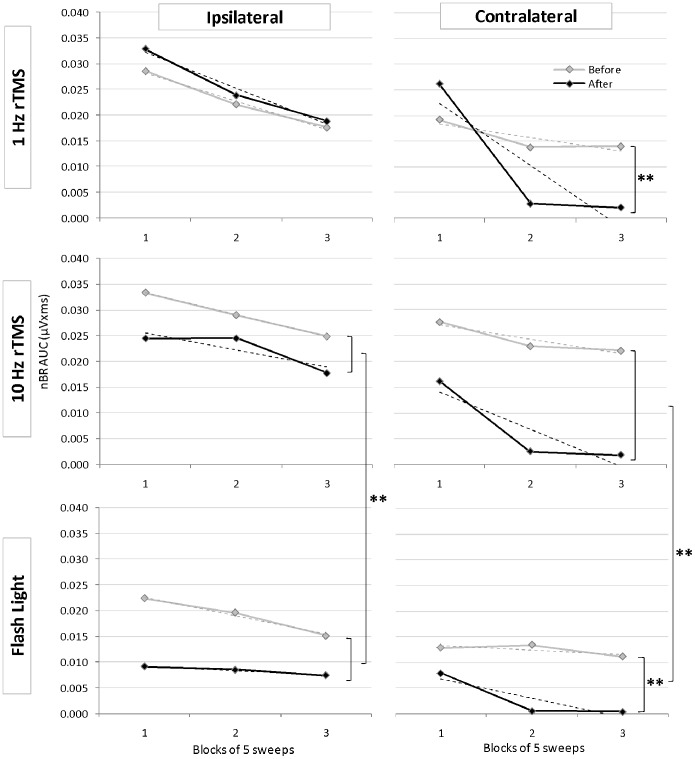
Figure 2. Area under the curve of ipsi- and contralateral nociceptive blink reflexes in 3 successive blocks of 5 averaged responses before (grey lines) and after (black lines) 1 Hz rTMS, 10 Hz rTMS over the visual cortex, or flash light stimulation.
Vertical brackets indicate significant differences before and after stimulation, or between stimulation modalities. ** p<0.01; * p<0.05.

