
Figure 2.
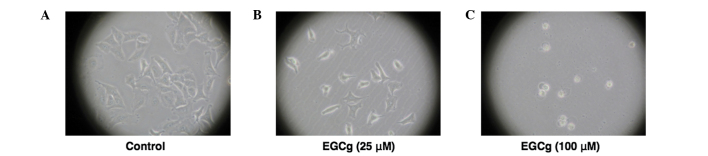
Effect of EGCg on the morphology of A549 cells. Representative morphology of A549 cells was microscopically observed in (A) control and following co-culture with (B) 25 μM and (C) 100 μM EGCg. EGCg, epigallocatechin-3-gallate.
Official websites use .gov
A
.gov website belongs to an official
government organization in the United States.
Secure .gov websites use HTTPS
A lock (
) or https:// means you've safely
connected to the .gov website. Share sensitive
information only on official, secure websites.
Effect of EGCg on the morphology of A549 cells. Representative morphology of A549 cells was microscopically observed in (A) control and following co-culture with (B) 25 μM and (C) 100 μM EGCg. EGCg, epigallocatechin-3-gallate.