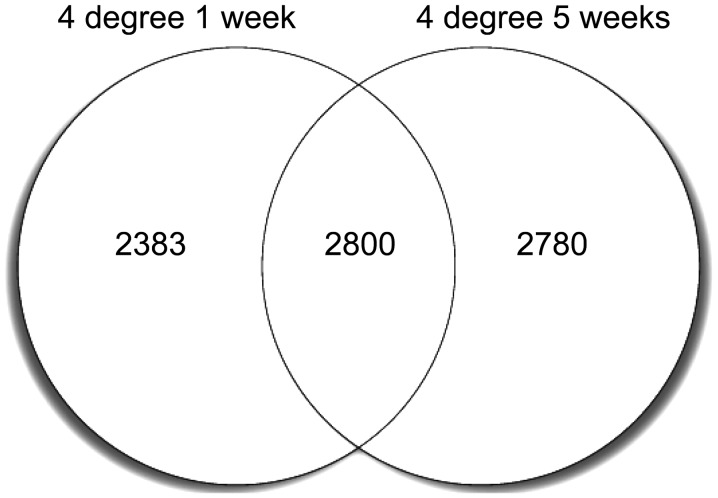
Figure 1.
Venn plot showing the identified DEGs in the two cold-exposure groups. A total of 5,183 DEGs were identified in the 4°C 1 week vs. 30°C 1 week group, while 5,580 DEGs were identified in the 4°C 5 week vs. 30°C 5 week group (FDR, <0.01). Among the DEGs, 2,800 genes maintained increased or decreased expression levels after week 1 and 5, while >2,000 genes were detected only at week 1 or 5. DEGs, differentially expressed genes; FDR, false discovery rate.

