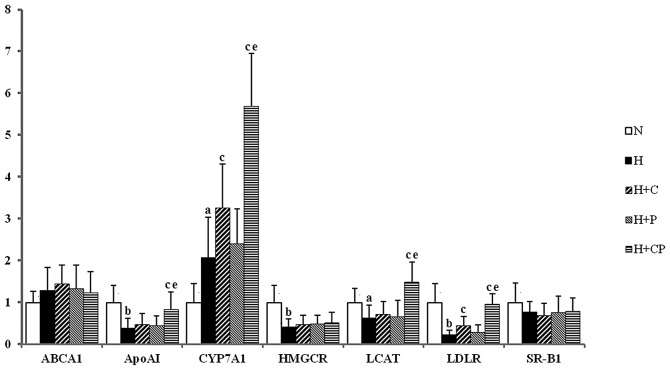
Figure 1.
Analysis of hepatic mRNA levels using quantitative polymerase chain reaction of rats in each group. The relative mRNA levels are presented as the mean ± standard deviation obtained from six rats in each group. aP<0.05, bP<0.01, vs. N group; cP<0.05, vs. H group; eP<0.05, vs. H + C group. N, normal control; H, high-fat diet control; H + C, high-fat diet plus curcumin; H + P, high-fat diet plus piperine; H+CP, high-fat diet plus curcumin plus piperine; ABCA1, ATP-binding cassette transporter A1; ApoA1, apolipoprotein AI; CYP7A1, cholesterol 7α-hydroxylase; HMGCR, HMG-CoA reductase; LCAT, lecithin cholesterol acyltransferase; LDLR, low-density lipoprotein receptor; SR-B1, scavenger receptor B1.

