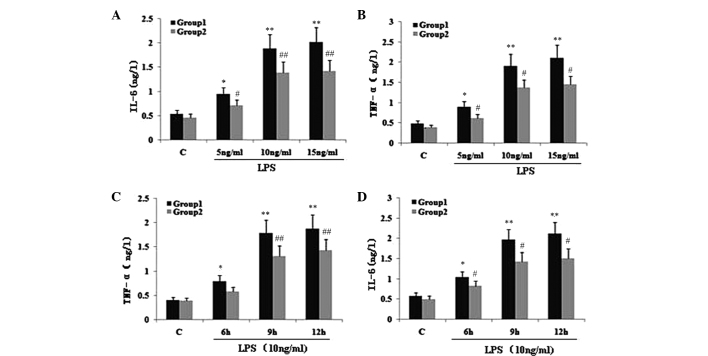
Figure 2.
Effect of TIPE2 on proinflammatory factors in LPS induced RAW264.7 cells. TIPE2 siRNA and control RAW264.7 cells were incubated with various concentrations of LPS for 9 h, or 10 ng/ml LPS for various time points. TNF-α and IL-6 levels in the supernatant were assayed using ELISA. Values are expressed as the mean ± standard deviation of three independent experiments. Groups: 1, TIPE2 siRNA RAW264.7 cells; 2, RAW264.7 cells; C, control. (A,B) Dose and (C,D) time dependent effects of LPS on IL-6 and TNF-α levels in RAW264.7 cells and TIPE2 siRNA RAW264.7 cells. (A,B) P<0.05, group 1 (5, 10 and 15 mg/ml) vs. group 2 (5, 10 and 15 mg/ml); group 1: *P<0.05, **P<0.01, vs. control; group 2: #P<0.05, ##P<0.01, vs. control. (C,D) P<0.05, group 1 (6, 9 and 12 h) vs. group 2 (6, 9 and 12 h); group 1: *P<0.05, **P<0.01, vs. control; group 2: #P<0.05, ##P<0.01, vs. control. TIPE2, TNF-α induced protein 8 like 2; LPS, lipopolysaccharide; TNF-α, tumour necrosis factor α; IL, interleukin; ELISA, enzyme linked immunosorbent assay.

