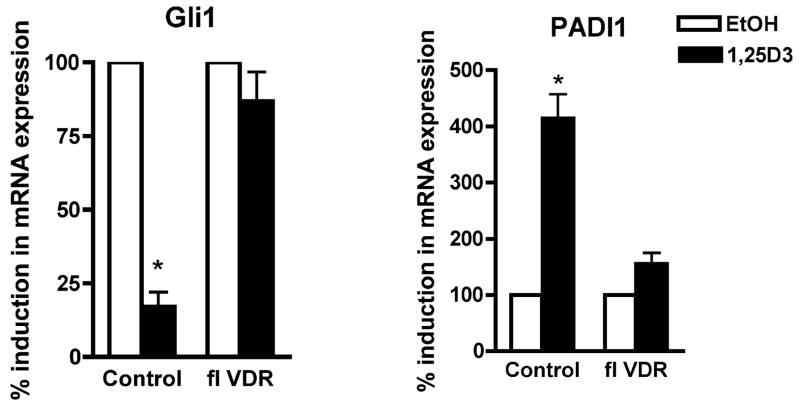
Fig. 2. 1,25(OH)2D3 repressed mRNA expression of Gli1 but induced PADI1 through VDR.
Mouse keratinocytes were isolated from floxed VDR mice. Cells were either infected by DNR adenovirus (control) or Cre adenovirus to block VDR expression (fl VDR). They were then treated with either EtOH (open bars) or 1,25(OH)2D3 (closed bars). Total RNA was isolated from using RNeasy RNA purification kit (Qiagen, Valencia, CA). The mRNA levels of Gli1 and PADI1 were measured by QPCR. Relative expression of these genes compared with mitochondrial ribosomal protein L19 was calculated. The mRNA levels were normalized to control gene L19, and relative expression to EtOH control group was expressed as a percentage (%). The fold changes compared with EtOH vehicle were calculated. The data are shown as mean ± SD of three different preparations of keratinocytes. Statistical significance (* p<0.05) compared with EtOH controls is shown with asterisks.

