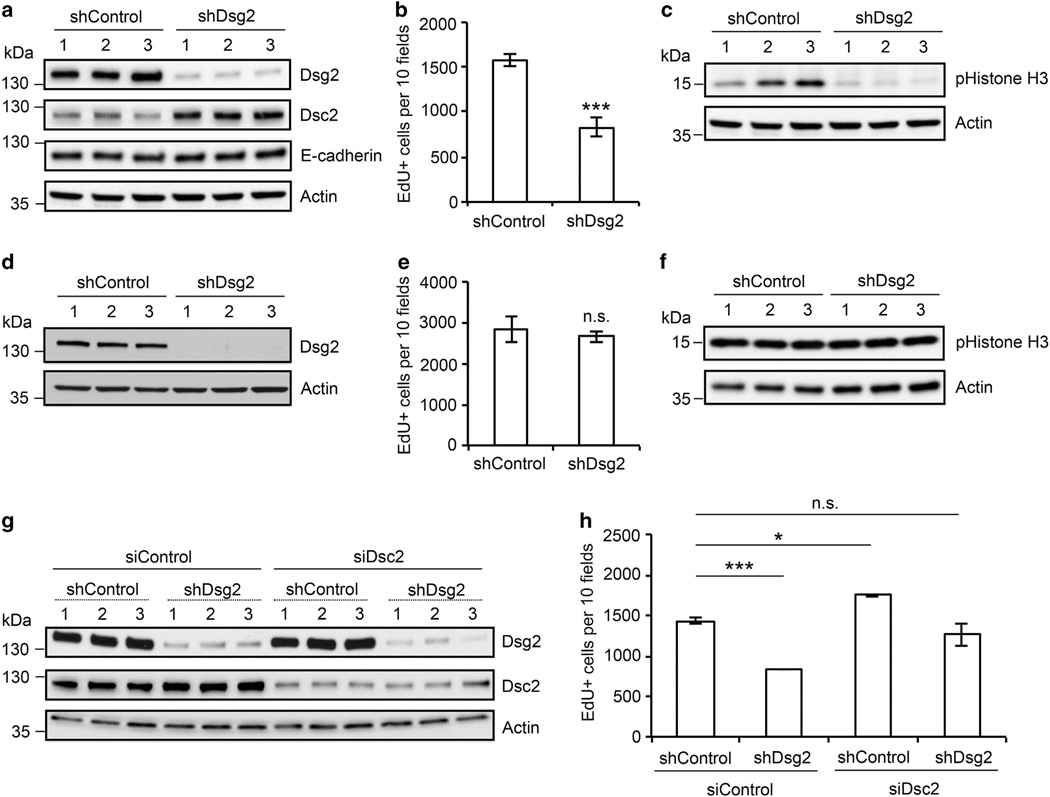
Figure 1.
Downregulation of Dsg2 in colon cancer cells reduces cell proliferation. (a) Immunoblot analysis demonstrating Dsg2, Dsc2 and E-cadherin levels in lentiviral-transduced desmoglein-2-specific shRNA (shDsg2, Open Biosystems, Huntsville, AL, USA) and control nonsilencing shRNA (shControl, Addgene, Cambridge, MA, USA) SK-CO15 cells. Cell lysates were subjected to immunoblot analysis against Dsg2 clone AH12.2 (generated in-house),18,21 Dsc2 clone 7G6 (Invitrogen, Carlsbad, CA, USA) and E-cadherin clone HECD-1.22 (b) Cell proliferation was measured by evaluating EdU incorporation. shControl and shDsg2 SK-CO15 cells were pulse labeled with EdU (Click-iT EdU, Invitrogen) for 1 h and processed to detect incorporated EdU. Images were obtained by confocal microscopy, and the number of EdU-positive nuclei was counted. ***P < 0.0001, t-test. (c) Immunoblot analysis of pHistone H3 levels in shControl and shDsg2 SK-CO15 cells. Total cell lysates of shControl and shDsg2 SK-CO15 cells were subjected to immunoblot analysis against pHistone H3 (Ser10, Cell Signaling, Beverly, MA, USA). (d) Immunoblot analysis confirming downregulation of Dsg2 in shDsg2 HeLa cells compared to shControl HeLa cells. (e) Proliferation of shControl and shDsg2 HeLa cells was determined by EdU incorporation. n.s., not significant (P = 0.2402, t-test). (f) Immunoblot analysis demonstrating pHistone H3 level in shControl and shDsg2 HeLa cells. (g) Immunoblot analysis confirming knockdown of Dsc2 in shControl and shDsg2 SK-CO15 cells after transfection with Dsc2-specific siRNA (siDsc2) and control siRNA (siControl) (Sigma-Aldrich, St Louis, MO, USA). (h) Proliferation of shControl and shDsg2 SK-CO15 cells transfected with siDsc2 was determined by EdU Incorporation. ***P < 0.0001, *P = 0.0499, n.s., not significant (P = 0.0694), t-test. Actin (Sigma-Aldrich) in a, c, d, f and g was used as a loading control. The histograms in b, e and h represent the mean number of EdU-positive nuclei from at least 10 different fields ± s.e.m.

