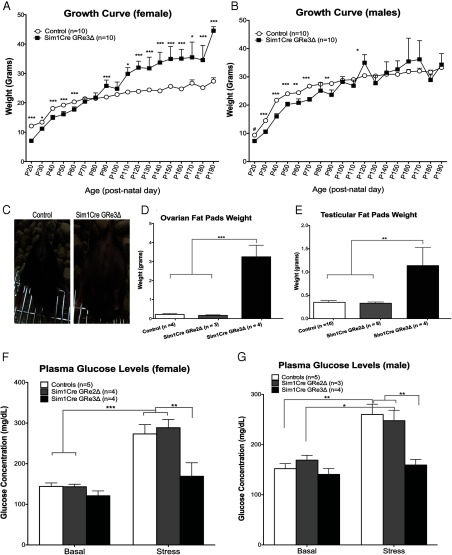
Figure 2.
Sim1Cre-GRe3Δ Mice Have Altered Growth, Fat Accumulation, and Stress Glucose Response. A and B, The mean (±SEM) body weights of control and Sim1Cre-GRe3Δ mice over a 6-month period in females (A) and males (B). C, Images depicting phenotype differences between female control and Sim1Cre-GRe3Δ mice at 4 months of age. D and E, Ovarian (D) and testicular (E) fat pad weight in each group of mice. F and G, Plasma glucose levels measured at nadir, peak, and after 20 minutes of restraint stress. Control and Sim1Cre-GRe2Δ mice display increased plasma glucose after stress (***, P < .001), whereas Sim1Cre-GRe3Δ mice do not (P > .05 in females (F) and males (G)). *, P < .05; and **, P < .01; ***, P < .001; ****, P < .0001.

