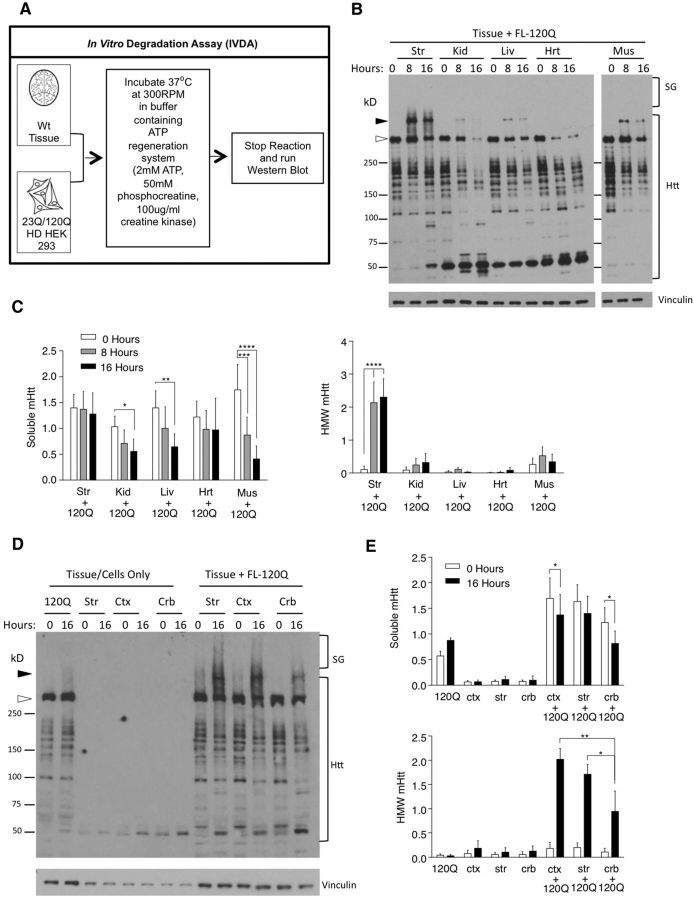
Figure 3.
In vitro degradation assay of mHtt stability. A, Schematic of IVDA. B, Representative Western blots (mEM48 1:50) of IVDA with striatum and peripheral tissues and different brain regions at 0, 8, and 16 h of incubation. The soluble full-length mHtt is indicated by open arrowhead, and the HMW mHtt is indicated by filled arrowhead. SG, Stacking gel. The cytoplasmic skeleton protein vinculin served as a loading control. C, All soluble mHtt fragments and full-length mHtt (left) and HMW mHtt (right) were quantified as a ratio to vinculin at 0, 8, and 16 h incubation (n = 4), and were normalized within the experiment to allow comparison between experiments. D, Comparison of the striatum (Str) with cortex (Ctx) and cerebellum (Crb) for their ability to process full-length mHtt by IVDA. Controls are cellular lysates only and tissue lysates only. Kid, Kidney; Liv, liver; Hrt, heart; Mus, muscle. E, All soluble mHtt fragments and full-length mHtt (top) and HMW mHtt (bottom) in D were quantified as a ratio to vinculin and normalized. Error bars indicate mean ± SEM, and statistical significance was determined using repeated-measures two-way ANOVA with (Fisher's LSD test) multiple testing (*p < 0.05, **p < 0.01, ***p < 0.001; see text for exact p values).

