Figure 5.
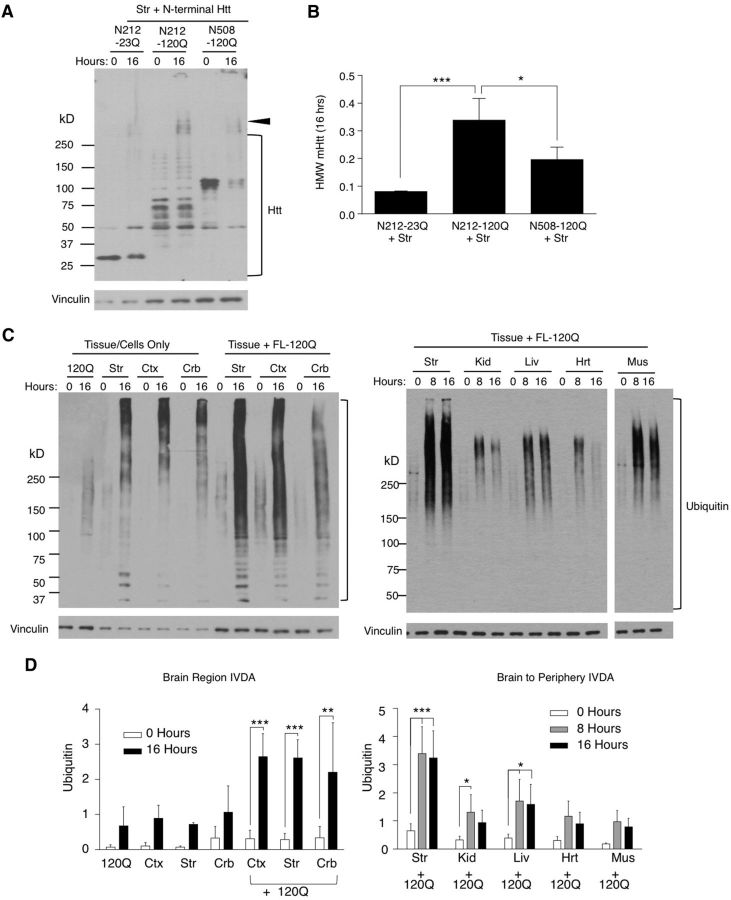
In vitro degradation of N-terminal mHtt fragments. A, B, N-terminal fragments of Htt (N212–23Q, N212–120Q, and N508–120Q) in transfected cell lysates were incubated with wild-type mouse striatal tissues in IVDA. Western blots (A) are shown, along with quantification of HMW mHtt (B) by two-way ANOVA with Bonferroni's multiple testing. Error bars indicate the mean ± SEM (*p < 0.05, ***p < 0.001). C, Western blot analysis of in vitro ubiquitination in brain and peripheral tissues. Total ubiquitin is compared among cortex, striatum, cerebellum, and peripheral tissues. Western blots are representative (n = 3) of IVDA with anti-ubiquitin (P4D1 1:1000). D, Quantification of total ubiquitin at 0, 8, and 16 h of incubation. Ubiquitin was quantified as a ratio to the loading control (vinculin) then normalized within the experiment. Error bars indicate the mean ± SEM, and statistical significance was determined using repeated-measures two-way ANOVA with multiple testing (*p < 0.05, **p < 0.01, ***p < 0.001, see text for exact p values). Str, Striatum; Ctx, cortex; Crb, cerebellum; Kid, kidney; Liv, liver; Hrt, heart; Mus, muscle.

