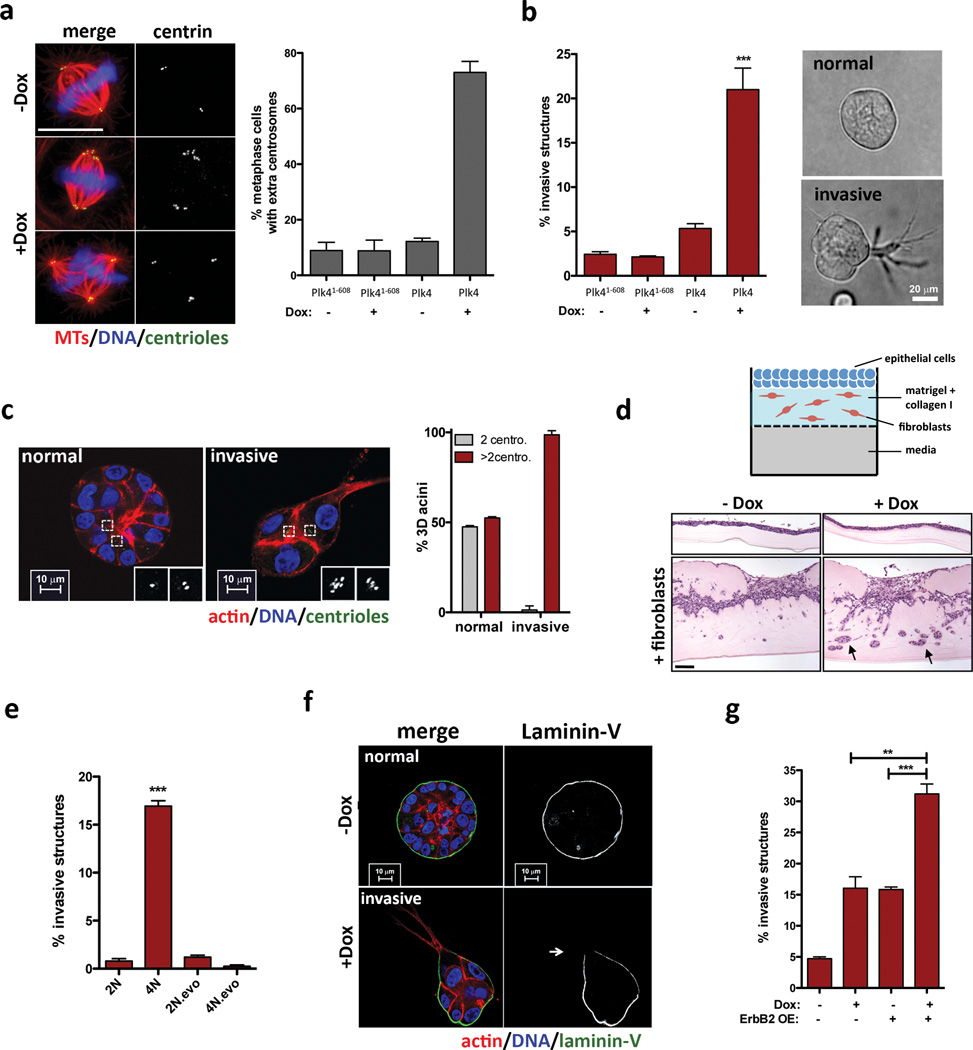
Figure 1. Invasive behavior of epithelial cells triggered by centrosome amplification.
a, Left: cells stained for microtubules (α-tubulin; red), centrioles (centrin2, green) and DNA (blue). Scale bar: 10µm. Right: fraction of cells with centrosome amplification. Error bars represent mean ± SE from 3 independent experiments. b, Left: fraction of invasive acini in 3-D cultures. Right: representative images of normal acinus and acinus with invasive protrusions. Scale bar: 10µm. Error bars represent mean ± SE from 4 independent experiments c, Left: cells stained for F-actin (red), centrioles (centrin1-GFP, green, inset white), and DNA (blue). Scale bar: 10µm. Right: Fraction of acini with centrosome amplification after Plk4 OE. Error bars represent mean ± SE from 3 independent experiments. d, Top: Scheme of the organotypic culture model used to assess invasion. Bottom: H&E staining if sections of MCF10A cells plated on the organotypic model, with and without fibroblasts (black arrows show highly invasive areas). Percentage of invasion: −Dox= 11.7±0.83; +Dox= 26.1±6.5. Scale bar: 100µm. e, Fraction of invasive acini in tetraploids. Error bars represent mean ± SE from 3 independent experiments. f, Acini stained for laminin-V (green), F-actin (red) and DNA (blue). White arrow indicates laminin-V degradation. Scale bar: 10µm. g, Fraction of invasive acini in cells that overexpress ErbB2, with or without centrosome amplification. Error bars represent mean ± SE from 3 independent experiments. All p-values were derived from unpaired two-tailed t-test (***, p<0.0005).

