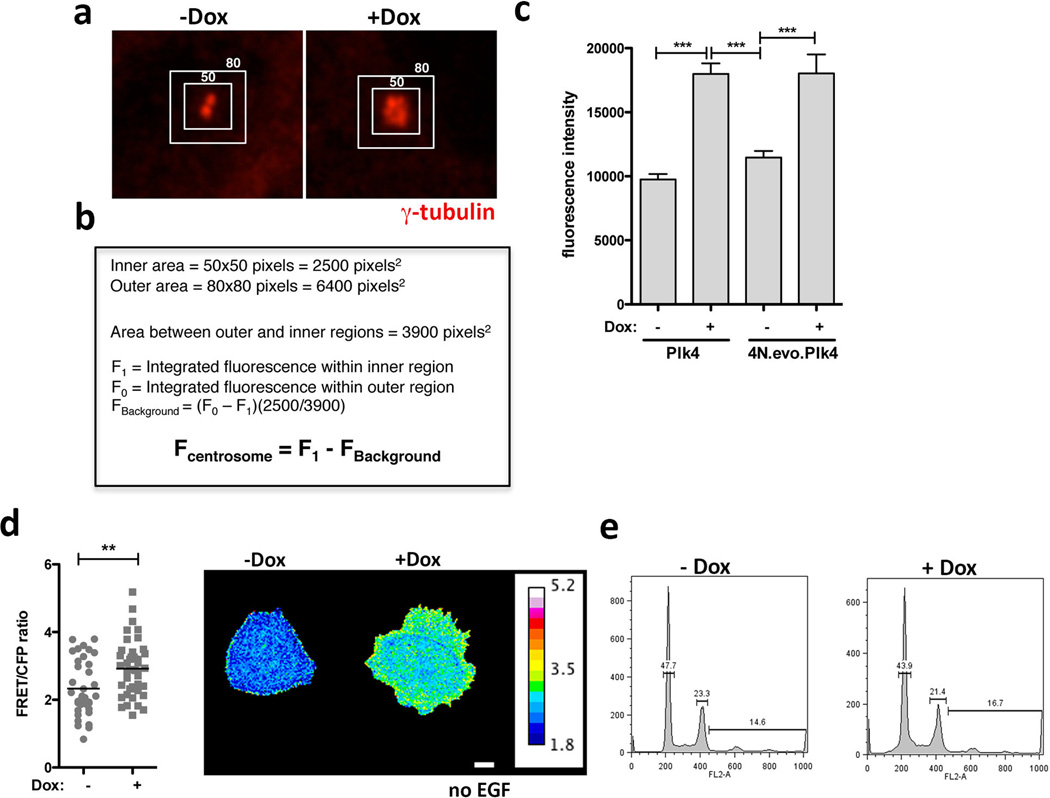
Extended Data Figure 9.
a, Images of centrosomes from interphase MCF10A cells stained for γ-tubulin. Boxes represent the region for measurement of centrosomal γ-tubulin signal (inside) and background (area between inside-outside boxes). b, Method used to determine the integrated fluorescent intensity of centrosomal γ-tubulin, as previously described40. c, Measurement of γ-tubulin intensity at the centrosomes showing that in interphase, increased centriole number is sufficient to increase γ-tubulin levels at the centrosomes whereas increased ploidy per se does not (4Nevo). nPlk4−Dox=60; nPlk4+Dox=49; n4N.evo.Plk4−Dox=34 n4N.evo.Plk4+Dox=35. Error bars represent mean ± SE. d, Increased Rac1 activity in cells with extra centrosomes can be detected in arrested cells deprived of EGF. Left: Quantification of Rac1 activity by FRET in single cells with (+Dox) and without (−Dox) extra centrosomes in the absence of EGF. Right: FRET images of cells in the absence of EGF. nPlk4−Dox=36; nPlk4+Dox=47. Error bars represent mean ± SE. Scale bar: 10µm. c, FACS profiles of control (−Dox) and cells with extra centrosomes (+dox) after 48hrs of Dox treatment showing that there is not major difference in the cell cycle profiles of these cells. Note that at this time point centrosome amplification does not produce a striking defect in cell proliferation (Extended Data Figure 1d). All the p-values were derived from unpaired two-tailed t-test (**, p<0.005; ***, p<0.0005).

