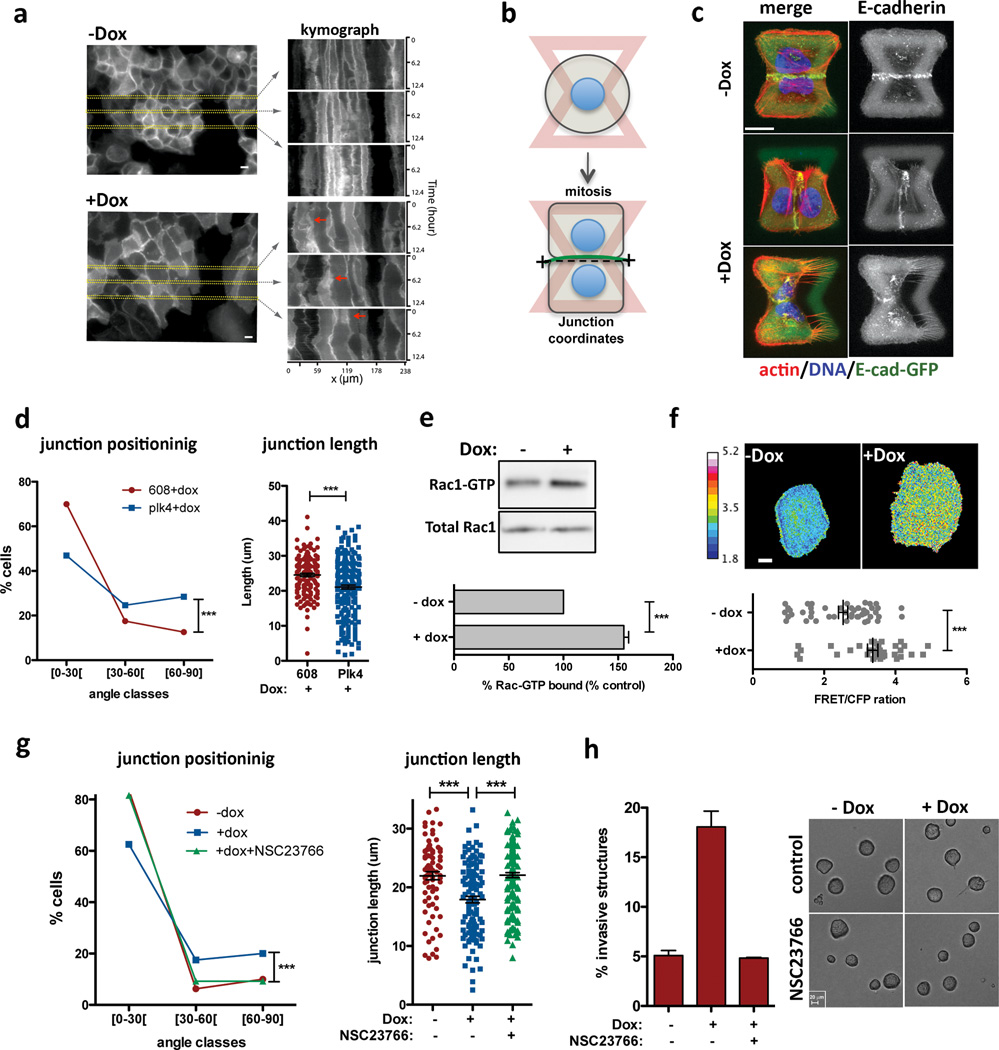
Figure 3. Centrosome amplification disrupts normal cell-cell adhesion because of Rac1 activation.
a, Kymograph analysis of cell-cell adhesion in live cells visualized with a plasma membrane marker (Rac-Raichu, CFP fluorescence). Red arrows mark areas of overlap. b, Scheme of the micro-pattern used. c, Images of cells (after mitosis) on micro-patterns labeled for E-cadherin (GFP; green), F-actin (red), DNA (blue), and fibronectin micro-pattern (green). Top: normal sized junction with a normal position (narrow angle); middle: abnormal junction position; bottom: smaller junction size. Scale bar: 10µm. d, Distribution of the cell-cell junctions angles (left) and size (right). n−Dox=143; n+Dox=216 Error bars represent mean ± SE. e, Top: Western blot from a pull-down experiment to detect GTP-bound Rac1. Bottom: quantification from 3 independent pull-down experiments. Error bars represent mean ± SE. f, Top: examples of FRET ratiometric images; color coded scale represents the level of Rac1 activation. Scale bar: 10µm. Bottom: levels of active Rac1 measured by FRET. n−Dox=50; n+Dox=38. Error bars represent mean ± SE. g, Inhibition of Rac1 with NSC23766 in cells plated on patterns. n−Dox=80; n+Dox=119; n+NSC23766=162. h, Left: fraction of invasive acini after treatment with NSC23766. Right: Images of control and NSC23766 treated acini. Scale bar: 20µm. Error bars represent mean ± SE from 3 independent experiments. All p-values p-values were derived from unpaired two-tailed t-test (***, p<0.0005).

