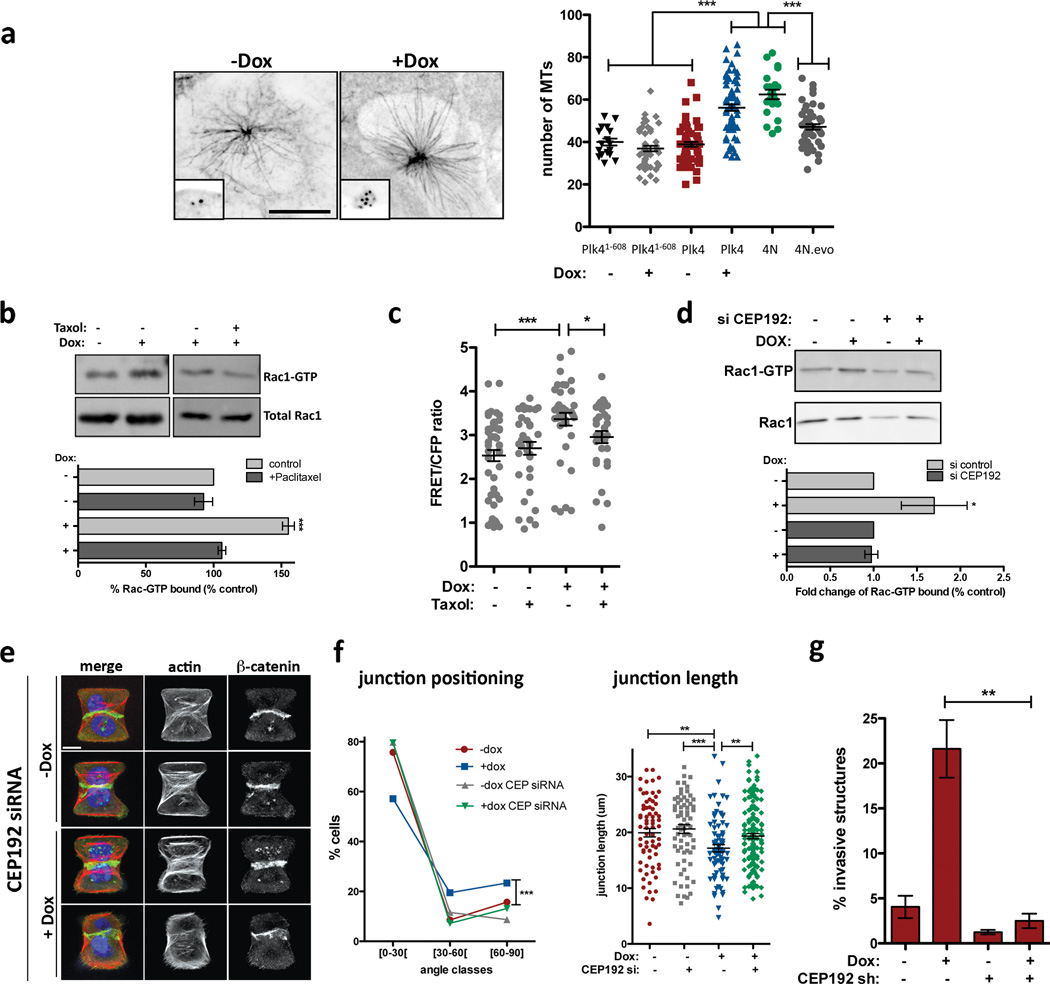
Figure 4. Effects of centrosome amplification are mediated by increased nucleation of centrosomal microtubules.
a, Left: images of microtubules (α-tubulin; insets: centrioles) in cells after microtubule re-growth. Right: Microtubule numbers from the indicated cells. nPlk4(1–608) −Dox=18; nPlk4(1–608)+Dox=51; nPlk4−Dox=66; nPlk4+Dox=71; n4N=22; n4N.evo=49. Error bars represent mean ± SE. b, Top: Pull-down assay to measure GTP-bound Rac1 after Paclitaxel treatment. Bottom: quantification of the levels of Rac1-GTP. Error bars represent mean ± SE from 3 independent experiments. c, FRET ratios for measuring active Rac1 in cells after the indicated treatments. n−Dox=50; n−Dox+Taxol=38; n+Dox=38; n+Dox+Taxol=32. Error bars represent mean ± SE. d, Top: Pull-down assay to measure GTP-bound Rac1 after CEP192 depletion by siRNA. Bottom: quantification of the levels of Rac1-GTP. Error bars represent mean ± SE from 4 independent experiments. p value derived from Wilcoxon test (*, p<0.05). e, Images of cells depleted of CEP192 on micro-patterns labeled for β-catenin (green), F-actin (red), DNA (blue), and fibronectin micro-pattern (green). Scale bar: 10µm. f, Angles and sizes of cell-cell junctions after depletion of Cep192 by siRNA. nctr.siRNA−Doc=71; nctr.siRNA+Doc=78; nCEP.siRNA−Dox=69; nCEP.siRNA+Dox=150. Error bars represent mean ± SE. g, Fraction of invasive acini seen after depletion of Cep192 by shRNA. Error bars represent mean ± SE from 3 independent experiments. For panels a, b, c, f and g, p-values were derived from unpaired two-tailed t-test (***, p<0.0005; **, p<0.005; *, p<0.05).

