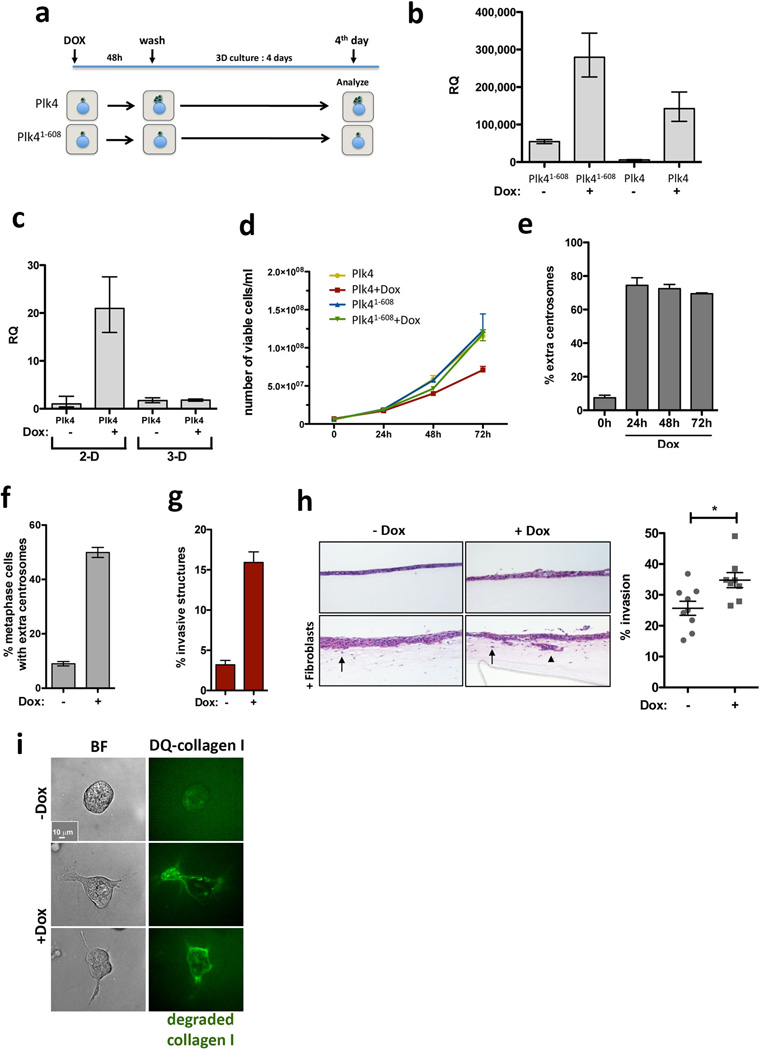
Extended Data Figure 1. Characterization of cells after transient overexpression of Plk4 or Plk41–608.
a, Scheme of the experimental design to induce centrosome amplification. Transient overexpression of Plk4 and Plk41–608 is achieved by addition of Dox for 48hrs (2-D culture) followed by removal of Dox and growth in 3-D culture for 4 days in the absence of Dox. b, qRT-PCR showing the levels of induction of the Plk41–608 and WT Plk4 transgenes in cells after 48hrs of Dox. Error bars represent mean ± SE from 3 independent experiments. c, qRT-PCR showing the expression of Plk4 after 48hrs of Dox (2-D) and after 4 days in 3-D cultures (3-D). Note that Plk4 OE after 4 days in 3-D cultures is shut-off. Error bars represent mean ± SE from 3 independent experiments. d, Proliferation curve of cells after induction of Plk4 and Plk41–608 over 72hrs. Centrosome amplification decreases cell proliferation. Error bars represent mean ± SE from 3 independent experiments. e, The fraction of cells with centrosome amplification at the indicated time points after Plk4 induction. Note that, since centrosome number is quantified in mitotic cells, this result demonstrates that cells with extra centrosomes can enter mitosis even after 72hrs of Dox treatment. Error bars represent mean ± SE from 3 independent experiments. f, Fraction of cells with centrosome amplification in a independently generated MCF10A.Plk4 cell line. Error bars represent mean ± SE from 3 independent experiments. g, Corresponding fraction of invasive acini in 3-D cultures. Error bars represent mean ± SE from 3 independent experiments. h, Centrosome amplification (Plk4 OE, +Dox) in non-transformed keratinocytes (HaCaTs) promotes invasion in the organotypic culture model. Left: Images show H&E staining of sections of HaCats cells. Black arrows indicate cells invading the matrix. Note that the invasion of groups of cells was only detected in the +Dox condition (Black arrowhead). Scale bar: 100µm. Right: Quantification of the percentage of cells that invade. Each dot in the graphic represents the percentage of invasion in each individual well/experiment analyzed. p-value was derived from unpaired two-tailed t-test *, p<0.05). i, Collagen-I degradation induced by centrosome amplification (green). Scale bar: 10µm. Please see Methods.

