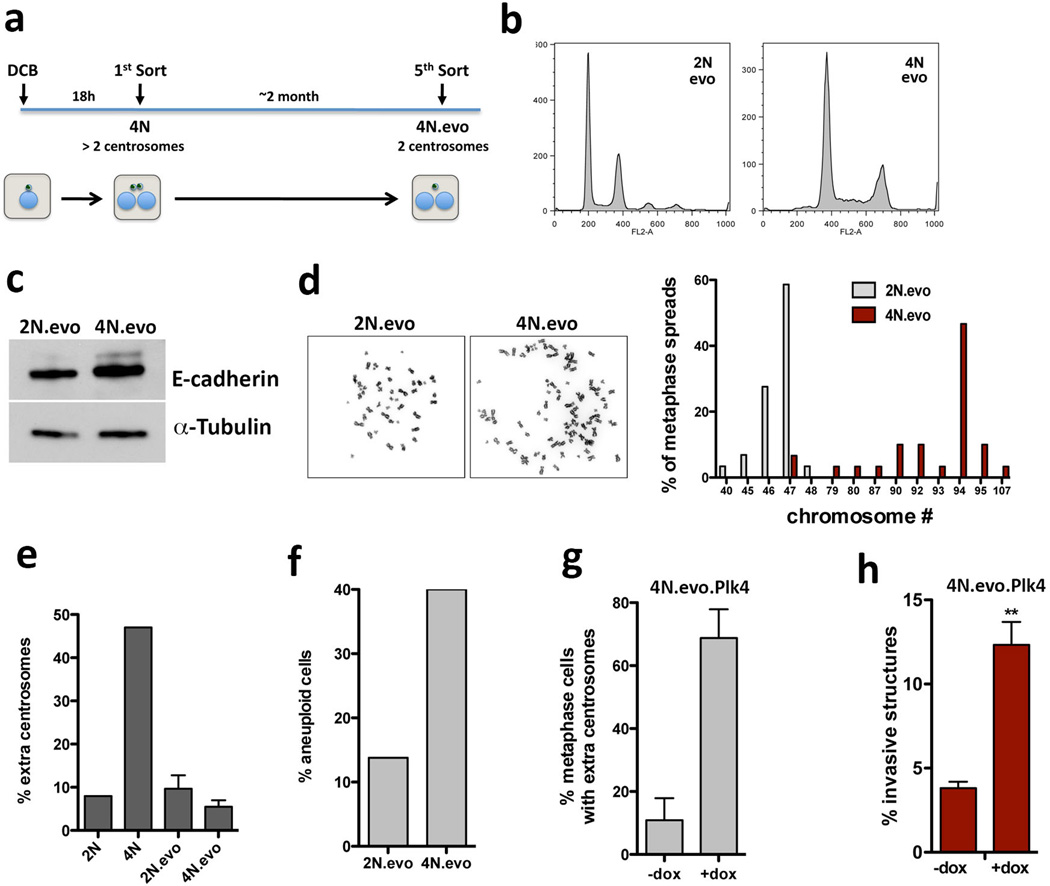
Extended Data Figure 2. Characterization of evolved diploid and tetraploid cells.
a, Scheme of the experimental design to obtain fresh MCF10A tetraploid cells with extra centrosomes (4N) and ‘evolved’ tetraploid cells that lost the extra centrosomes (4N.evo), as previously described2. b, FACS profiles of ‘evolved’ diploid (2N.evo) and tetraploid cells (4N.evo). c, Western blotting to detect E-cadherin in the ‘evolved’ cells indicates that 4N.evo maintain epithelial characteristics. d, Left: representative images of metaphase chromosome spreads of 2N.evo and 4N.evo. Right: quantification of chromosome number by karyotyping (~30 chromosome spreads were quantified in each condition). 4N.evo cells have a near-tetraploid karyotype. e, Centrosome amplification in diploid cells (2N or 2N.evo) newly generated tetraploid cells (4N) and evolve d tetraploid cells (4N.evo). f, Quantification of the percentage of aneuploid cells in the ‘evolved’ cells. The 4N.evo cells are aneuploidy despite their near-tetraploid genomes (~30 chromosome spreads were quantified in each condition). g, Quantification of centrosome amplification of 4N.evo cells overexpressing Plk4. Error bars represent mean ± SE from 3 independent experiments. h, Quantification of the invasive acini in 4N.evo cells after Plk4 OE. This experiment serves as a control to demonstrate that the 4N.evo cells retain their ability to amplify centrosomes and, after centrosome amplification, retain the capacity to form invasive acini. Error bars represent mean ± SE from 3 independent experiments. p-value derived from unpaired two-tailed t-test (**, p<0.005)

