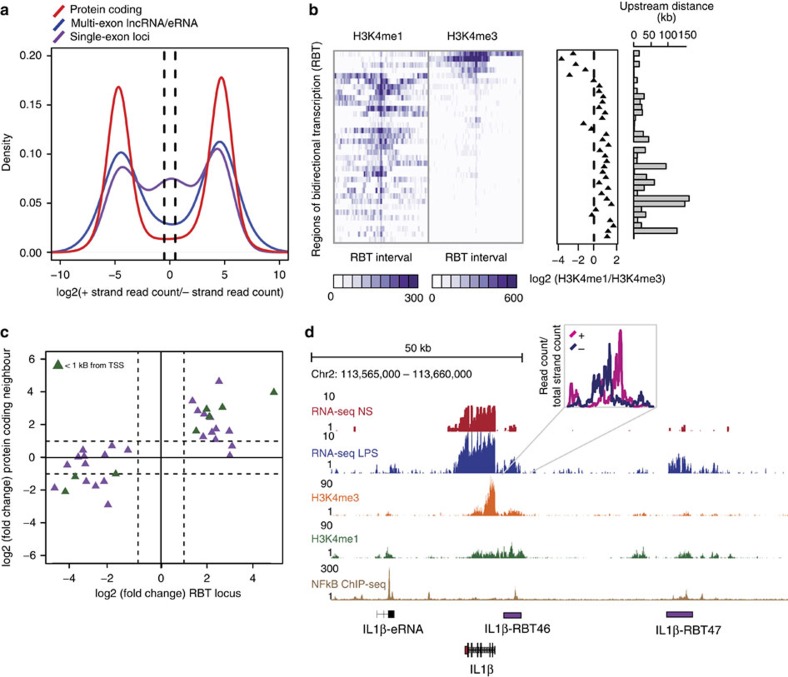
Figure 4. Bi-directional transcription defines a second set of eRNAs.
(a) Distribution of the ratio of forward strand/reverse strand read counts for monoexonic loci, lncRNAs (including eRNAs) and protein-coding genes. Dashed lines indicate a forward strand/reverse strand ratio of 2. The distribution for monoexonic loci suggests a subset of loci that are transcribed from both DNA strands (ratio<2). (b) H3K4me1 and H3K4me3 profile across differentially expressed RBT. RBT distally located from protein-coding genes display enhancer chromatin signatures. (c) Scatterplot displaying the relationship between the fold changes observed (log2) for RBT and fold changes (log2) for their nearest downstream protein-coding gene. Solid line indicates no change and dashed lines indicate fold changes>2. (d) In addition to a uni-directional eRNA downstream of IL1β, 2 upstream RBT are regulated by LPS and have evidence for NF-κB binding (lower panel).

