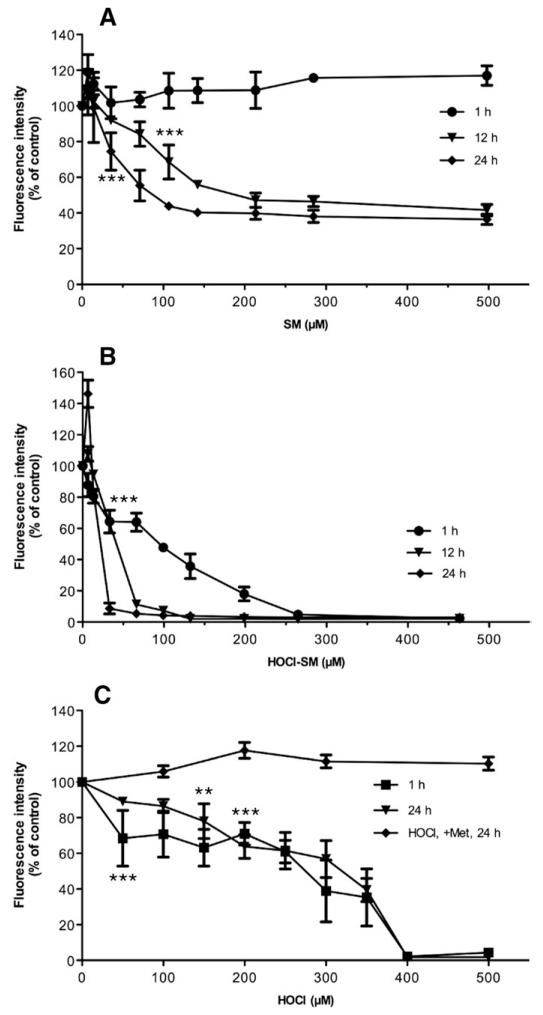
Fig. 5. Mitochondrial membrane potential (Δψm) of SM-, HOCl-SM-, and HOCl-treated PC12 cells.
Δψm was analyzed using the JC-1 assay. Cells were incubated in the presence of (A) SM, (B) HOCl-SM, or (C) HOCl at the indicated concentrations for the indicated times. Results were calculated by division of red fluorescence by green fluorescence and are expressed as fluorescence intensity as a % of control and represent the means ± SD (n = 3). **p<0.005; ***p<0.001. For clarity p values are shown only for the first data point reaching significance.

