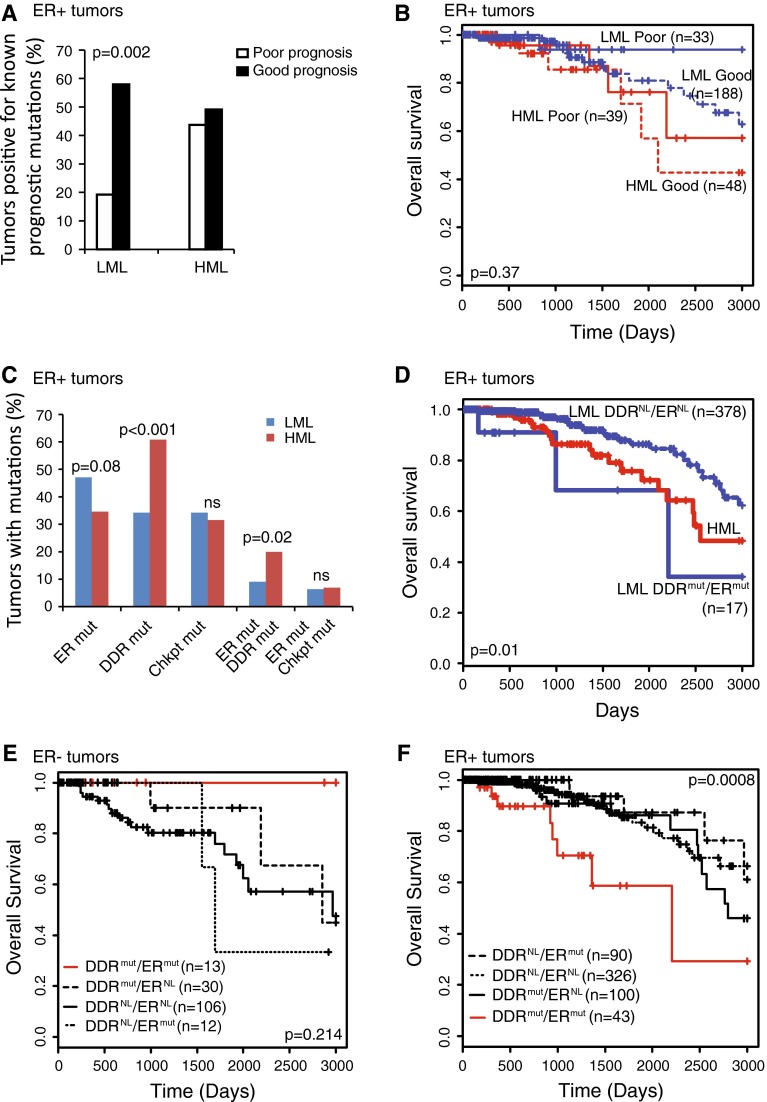
Fig. 4.
Coincident mutations in DDR and ER signature genes associate with poor survival irrespective of mutation load. a Percentage of tumors with mutations in genes associated with either good or poor prognosis in specified subsets. Fisher’s exact test was used to determine the p-value. b Kaplan–Meier survival curves of indicated groups. Log-rank test was used to generate p-values. c Bar graph depicting the percentage of tumors with mutations in the specified pathways. Fisher’s exact test was used to identify p-values. The list of ER signature genes is presented in “Materials and methods” section. d–f Kaplan–Meier survival curves of indicated groups. Log-rank test was used to determine p-values. ER, ER signature genes; DDR, genes from the five major DNA damage response pathways; Chkpt, genes from the DNA damage checkpoint; mut, tumors with non-silent mutations in genes from the specified pathway; NL, tumors with no identified mutations in genes from the specified pathway; ns, not significant

