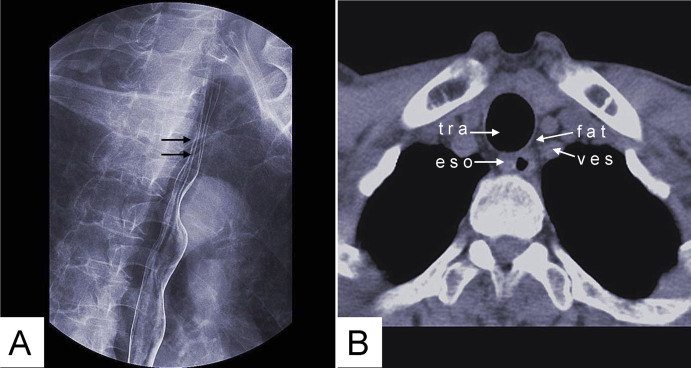
Figure 3. Gas-barium double contrast X-ray image (A) and CT axial view image (B) of normal esophageal tissue.
(A) Mucosa shows many setuliforms high-density shadow (double arrow). (B) CT demonstrates the esophageal wall and the relation with adjacent tissues. tra: trachea; fat: fat tissue; ves: blood vessel; eso: esophageal wall.

