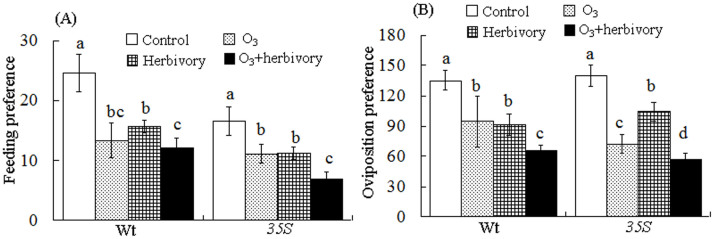
Figure 2. Effects of elevated O3 concentration and whitefly infestation on the feeding and oviposition preferences of whiteflies after three weeks on the two tomato genotypes.
Each value represents the average (±SE) of 15 replicates. Different lowercase letters indicate significant differences between the four treatments for a specific tomato cultivar (X2 test: P < 0.05).

