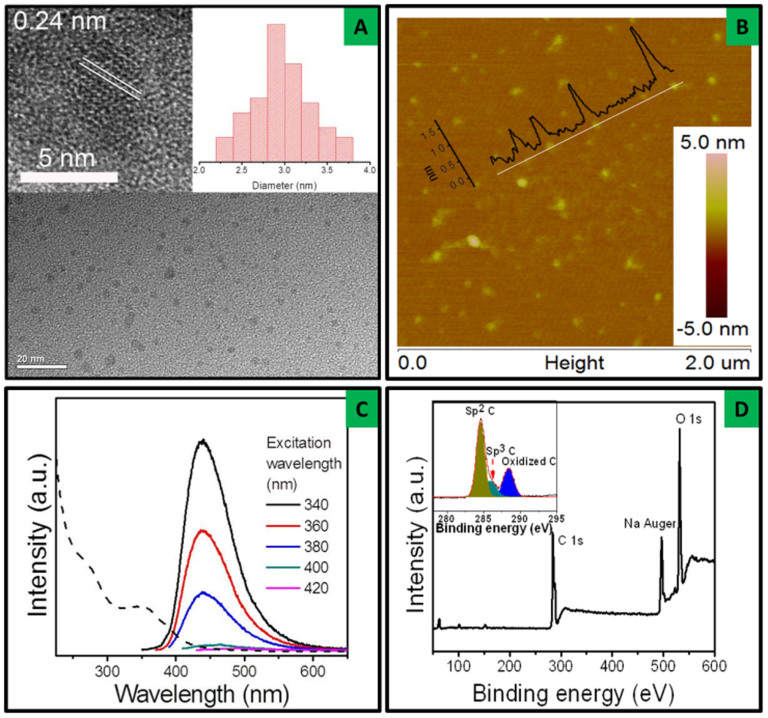
Figure 1. Characterizations of GQDs-NaOH.
(A) Representative TEM images of GQDs- NaOH. Inset panels show the HR-TEM image (left) and size (diameter) distribution (right). (B) SPM height image of the graphene nanoparticles. Line through some of the GQDs-NaOH shows the height profile. (C) UV-Vis spectrum (dash curve) and photoluminescence spectra (solid curves) of the graphene nanoparticles. (D) X-ray photoelectron spectroscopy (XPS) full scan survey and the high-resolution C1s spectra are shown in inset.

