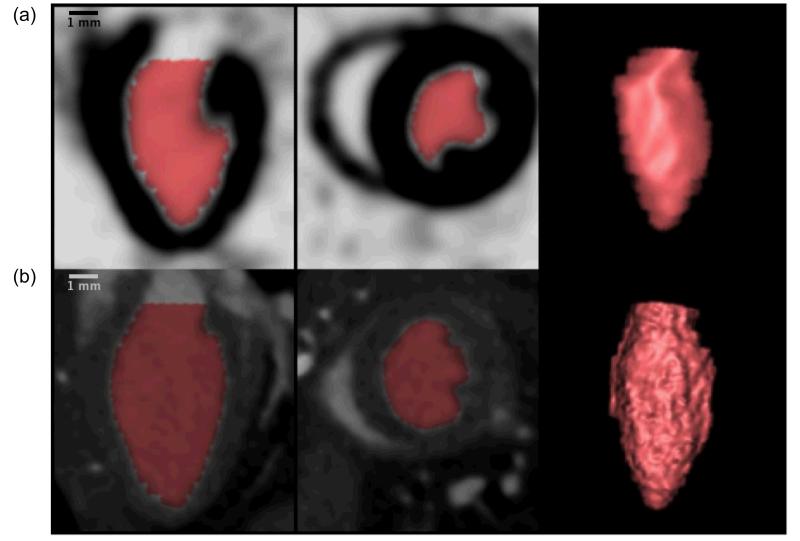
Figure 3.
Sagittal long axis view, axial short axis view, and 3D-rendering of the left ventricle in the mouse from microSPECT (a) and microCT (b) datasets, demonstrating volumetric segmentation of the left ventricle using Vitrea LV functional analysis software. Note the increased detail in the microCT-based 3D rendering, reflective of higher spatial resolution compared with microSPECT.

