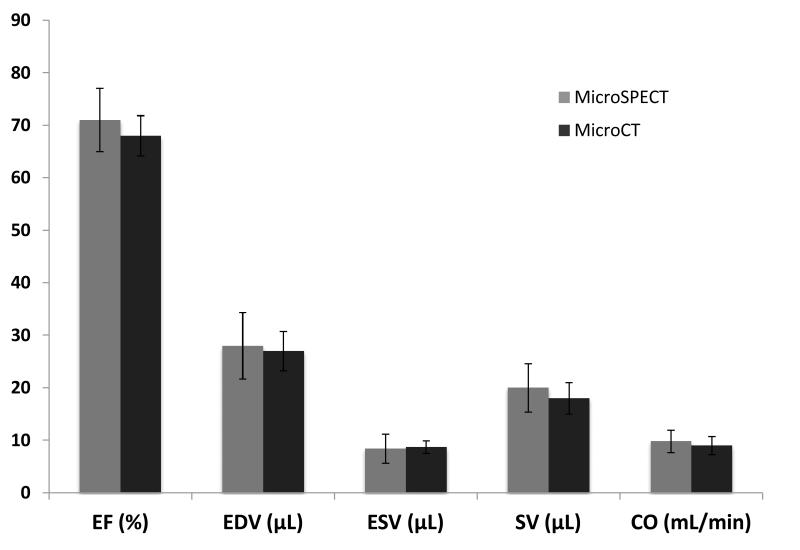
Figure 5.
Comparison of global cardiac functional indices in microSPECT (n=6) and microCT (n=6) groups based on volumetric analysis of the left ventricle (LV) in Vitrea software; bars respresent the average of all animals (n=6) in that study group. No statistically significant differences were found. Error bars represent ± one standard deviation. Mean heart rate was 485±10 for microSPECT and 490±17 for microCT (p=0.53). (EF=ejection fraction; EDV= end-diastolic volume; ESV=end systolic volume: SV=stroke volume; CO=cardiac output)

