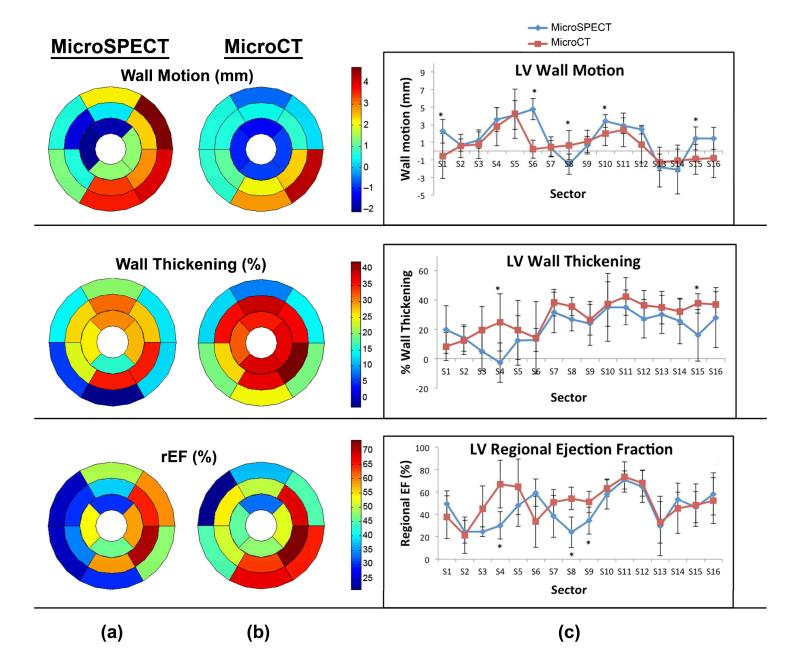
Figure 6.
Regional parameter quantification and comparisons in microSPECT (n=6) and microCT (n=6) groups using Vitrea software. (a, b) Composite bullseye plots for wall motion, wall thickening, and regional ejection fraction are shown, and represent the average values for for all mice in that study group (n=6). (c) Intercomparison of regional functional indices, calculated from 17-sector bullseye plot representations of the left ventricle according to American Heart Association guidelines [33]. Asterisks indicate that a statistically significant difference was found between the two modalities in that sector (p≤.05).

